Reports and Output on ARS
In previous sections, we covered the introduction of AUEM/DVM, its components, installation, and basic configurations. Administrators must understand how AUEM/DVM and ARS configurations can help diagnose system issues, identify areas of concern in VDI deployments, assess overall deployment health, and detect performance bottlenecks.
In this section, we will discuss several reports and graphs from ARS that are generated using data shared by AUEM/DVM.
Sample Output on ARS
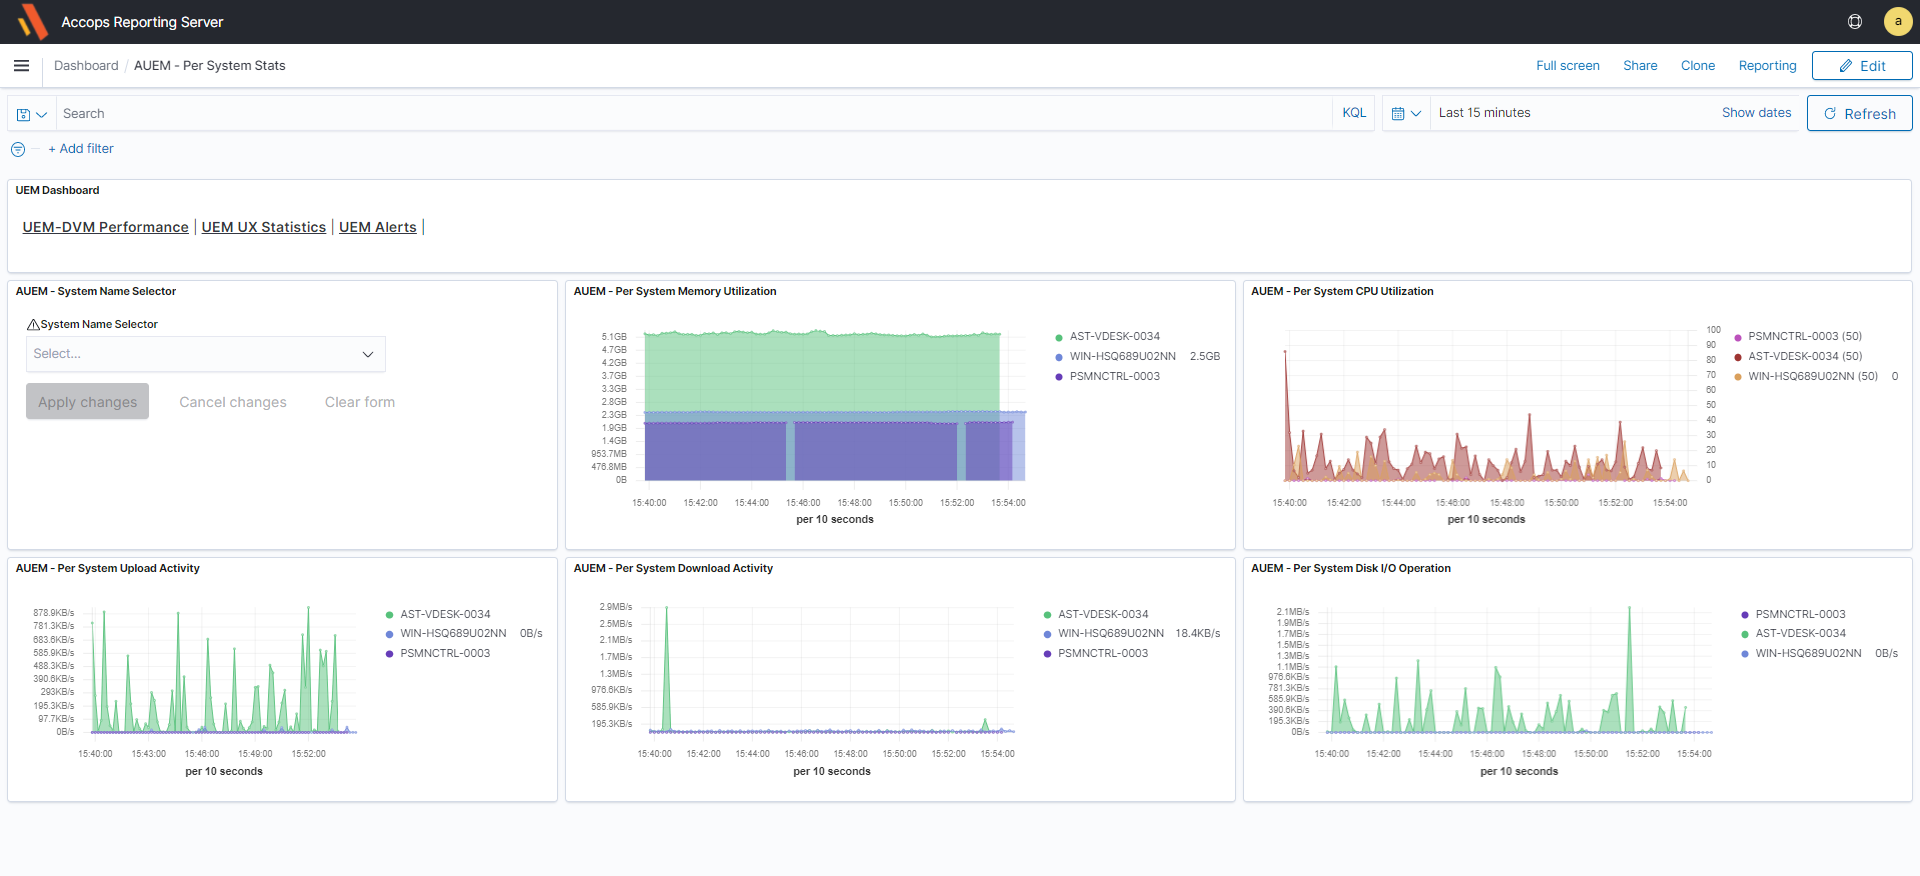
System (Virtual Desktop) Performance
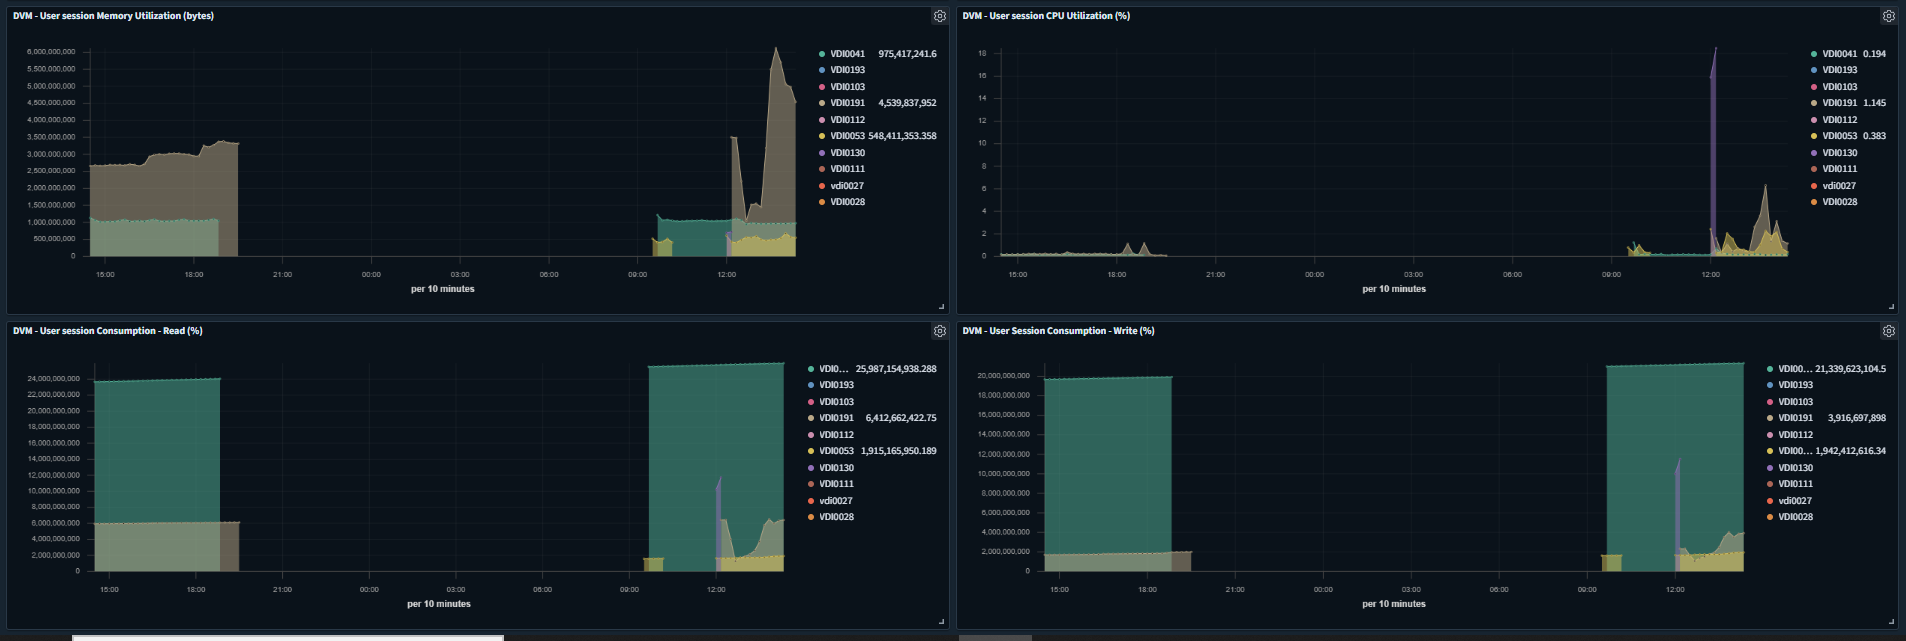
Once the system performance monitoring is enabled, the following performance graphs of the configured desktops are available on ARS:
-
User Session Consumption - Read (%)
-
User Session Consumption - Write (%)
-
User session CPU Utilization (%)
-
User session Memory Utilization (bytes)
Based on the graphs, the Administrator can identify systems running low on resources or experiencing high resource utilization, and resolve the issues to improve the user experience.
Windows Events Monitoring
DVM provides logon and critical event data to ARS, which can be used to identify:
-
Overall Logon Experience of end-users
-
Identify systems having some critical functional issues
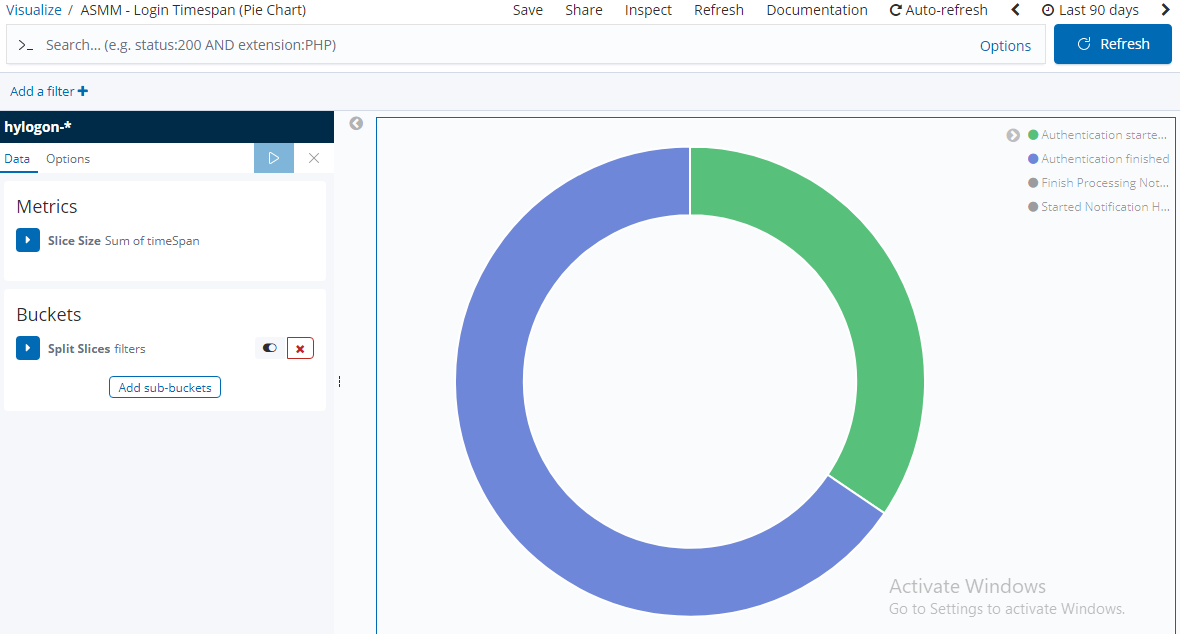
User Logon Time
A user will be able to access the provided remote desktop once all logon processes are completed and the desktop is ready for use.
The user logon process, which encompasses everything from initiating the connection to displaying the remote desktop, can be broken down into several sub-tasks, such as user authentication and group policy processing.
This detailed information can help identify specific transactions that are taking longer than expected, enabling corrective actions to improve the user experience.
Below are examples of graphs available on ARS that illustrate user logon times:
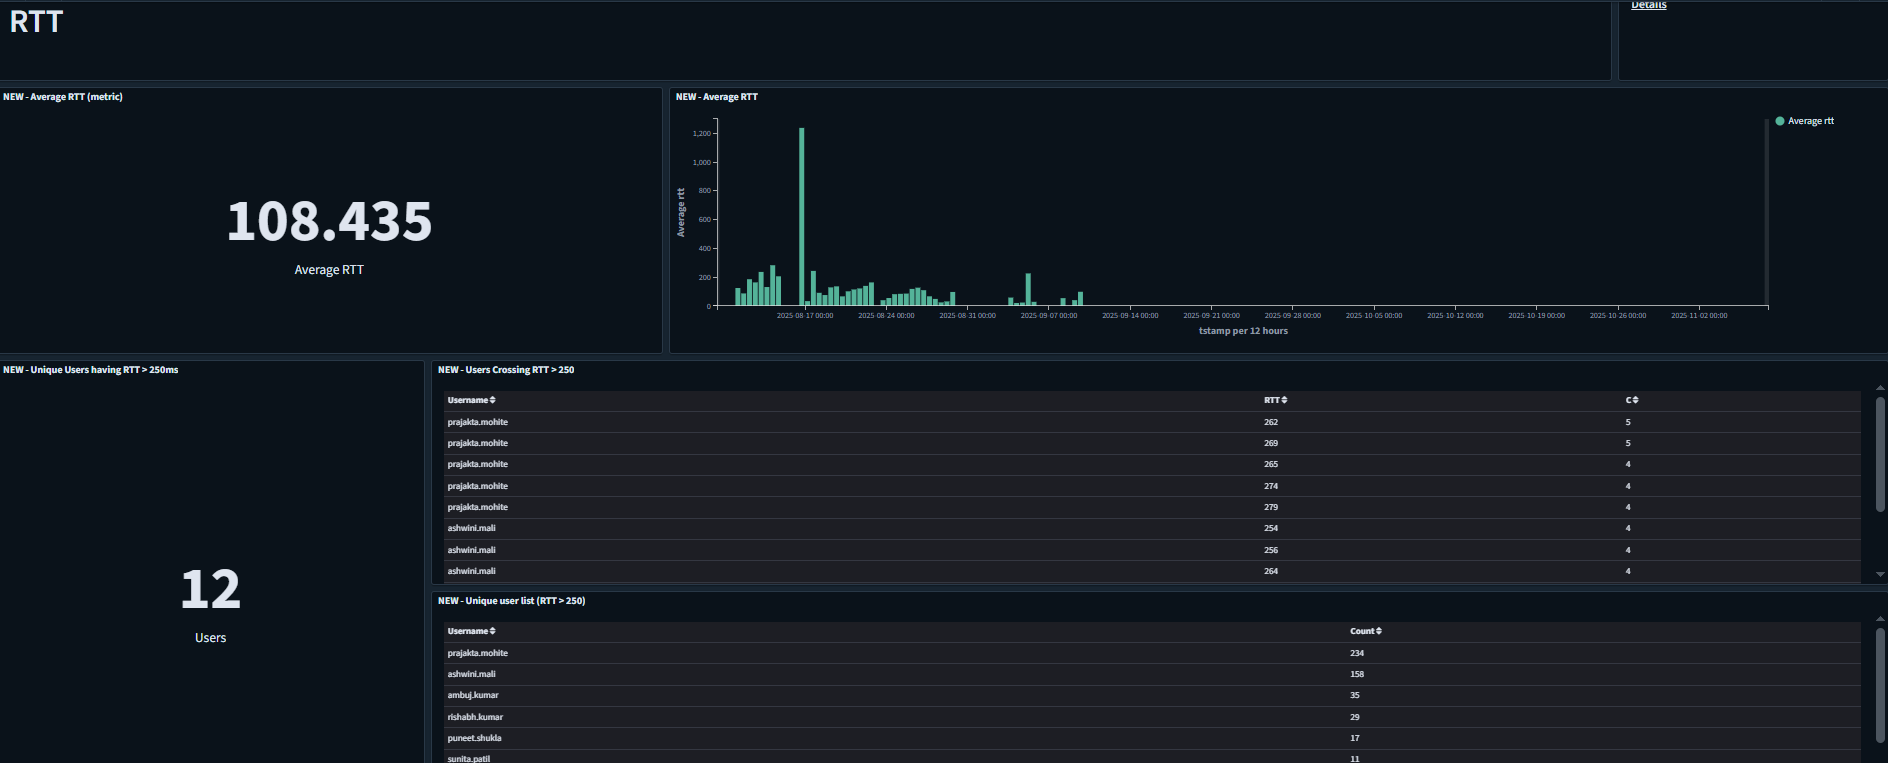
Round Trip Time
Round-trip time (RTT) in networking is the time between a data request and the display of the data.
For more details on AUEM configuration on ARS, refer to AUEM DVM configuration.