End Point Security Logs
The activities related to Endpoint Devices which are expected to go through an EPS scan get logged and are displayed on the Management console. To view these logs, follow the steps:
- Open the Management console and expand LOGGING
- Click on End Point Security Logs sub-menu
- All activity logs related to EPS or Device Profile activity, are displayed on this page. The different fields displayed are described below:
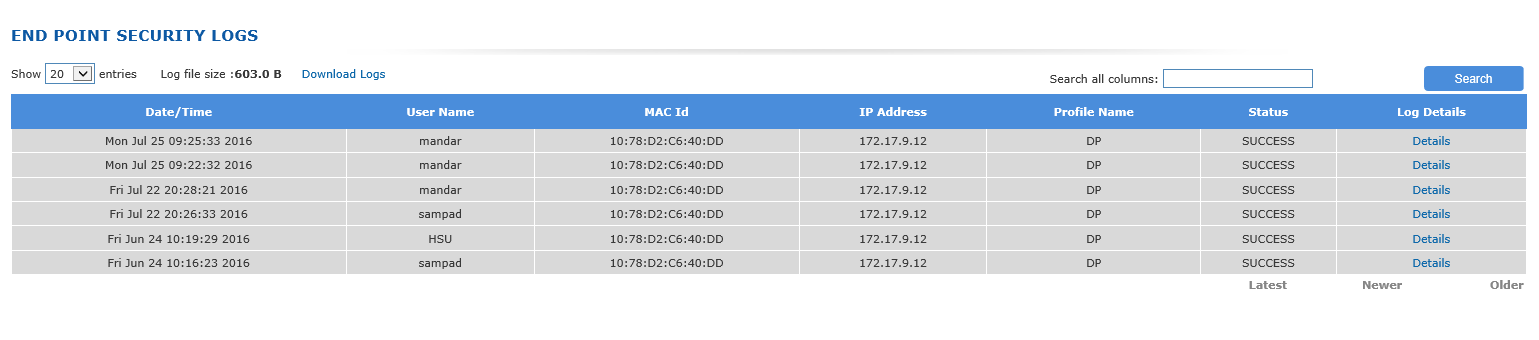
| # | Column Name | Description |
|---|---|---|
| 1 | Date/Time | This represents the time of User logon to the HySecure Gateway |
| 2 | User Name | This represents the name of the user who attempted login from an Endpoint Device |
| 3 | MAC Id | This represents MAC ID of the network interface through which the user requested login |
| 4 | IP Address | This column lists the IP Address of the client device from which the Administrator / SO has logged in to the Gateway. Note that if the device is behind a NAT'ed device, then this column would indicate the private IP of the device where as the column "WAN IP Address" will indicate the Public IP address from which the user has connected to the Gateway. |
| 5 | WAN IP Address | This represents the WAN IP Address i.e. the public IP from which the user has connected to the Gateway. Note that if the user's machine is behind a NAT'ed device, then this column would indicate the NAT'ted IP. |
| 6 | Country | This indicates the country from which the user login was attempted |
| 7 | State | This indicates the State from which the user login was attempted |
| 8 | City | This indicates the City from which the user login was attempted |
| 9 | Profile Name | This indicates the [Device Profile]|(../../content_endpoint_management/device_profiles.md) which matched the Endpoint details |
| 10 | Status | This represents whether the Endpoint match was successful or it fell into Quarantine profile |
| 11 | Source Node | |
| 12 | Log Details | This is a link clicking which the details and results of the device profile scan are listed. An sample image is displayed below |

Click Close Window to close detailed log screen.
End Point Security Logs Display Management
Controlling Number of Entries Per Page
On the drop down against the label "Show", select the number of entries as 20, 50 or 100 to display the corresponding number of log entries on the page. For viewing subsequent log entries, click on link "Next" which is available at the end of the page. The link "Previous" at the end of the page will take you to the previous list of entries. The link "Latest" will take you to the latest set of entries.
Log File Size
The current log file size is displayed against the label "Log file size:".
Download Logs
Click on the link "Download Logs" to download the latest EPS logs i.e. the active log file, which get displayed through the "End Point Security Logs" sub-menu, in a csv format. The downloaded file name is "EpsLog.csv", if no such file name exists in the download folder.
A maximum of 30,000 latest log entries can be downloaded.
Filter Logs
The logs can be filtered on any text in any of the columns by entering the search string in the text box for "Search all columns:" and clicking on the "Search" button