Dashboard
The dashboard serves as the default homepage when launching the Management Console. It displays some of the critical real-time information about HySecure. The information is logically grouped under different widgets.
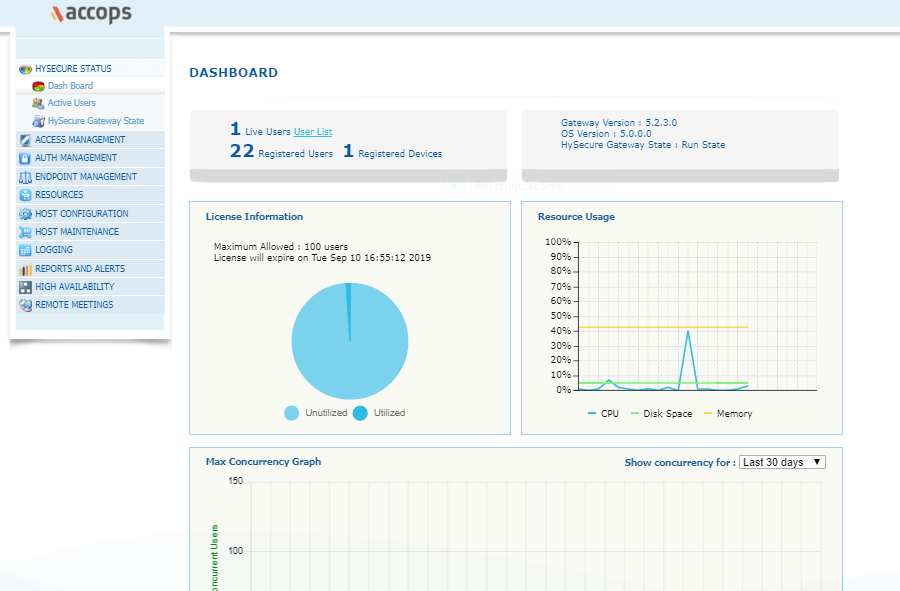
The initial widgets provide information related to the registered Users and Devices. The information displayed is:
-
Live user count i.e the number of users currently logged in to the Gateway. Along with this count, a link to the live users is also provided which would provide the active user details.
-
the count of registered users. Registered users are the unique users that have logged-in into HySecure. The details of these users is available on the User Profiles page under AUTH MANAGEMENT, and
-
the count of registered devices on HySecure gateway. Registered devices are the devices from which users have logged in. The details of these devices are available on the Device Management page under ENDPOINT MANAGEMENT
The next widget displays the various version information and state of HySecure. The list includes:
-
Gateway version: This indicates the version of HySecure Gateway deployed
-
OS Version: This indicates the Accops OS version on which the HySecure executes
-
HySecure Gateway State: This represents whether the Gateway is currently in a configured state or Run state. The Gateway should be moved to Run state for it to start functioning
-
Information about the state of this Gateway being Active or a standby Gateway and its IP address
Described henceforth are the different widgets and the information provided as part of these.
License Information
The License details shows the maximum concurrent users allowed as per license and the license expiry date.
It also shows a Pie chart showing the utilized and un-utilized license usage. A mouse rollover would indicate the maximum percentage of licenses which have been utilized till the date of viewing the information.
Average Resource Usage
The chart shows server hardware resource usage as a %age of the total available resources, such as the utilization of CPU, Disk Space and Memory. The chart is updated every 5 seconds.
Max Concurrency Graph
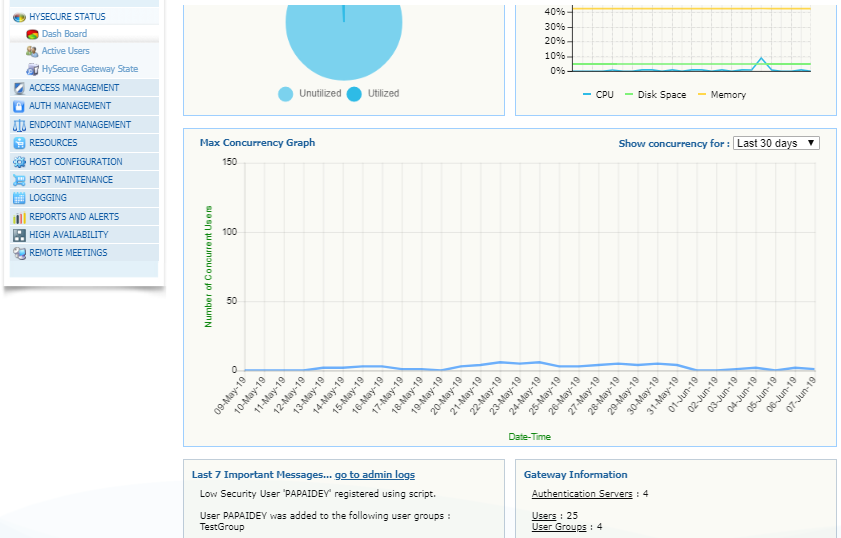
This graph displays the maximum concurrent users i.e users simultaneously logged in to HySecure, for a specific duration. The duration can be selected from the top right side of the graph from the drop down list Show concurrency for:. The allowed duration for which this graph can be viewed are last 30 days, last 7 days and last 24 hours.
If the administrator selects "Last 30 days" or "Last 7 days", then the graph shows maximum concurrent users for all 30 days or 7 days respectively, from the current day. If "Last 24 hours" is selected then the graph will show the maximum concurrent users for every hour, for the last 24 hours.
Last 7 Important Messages
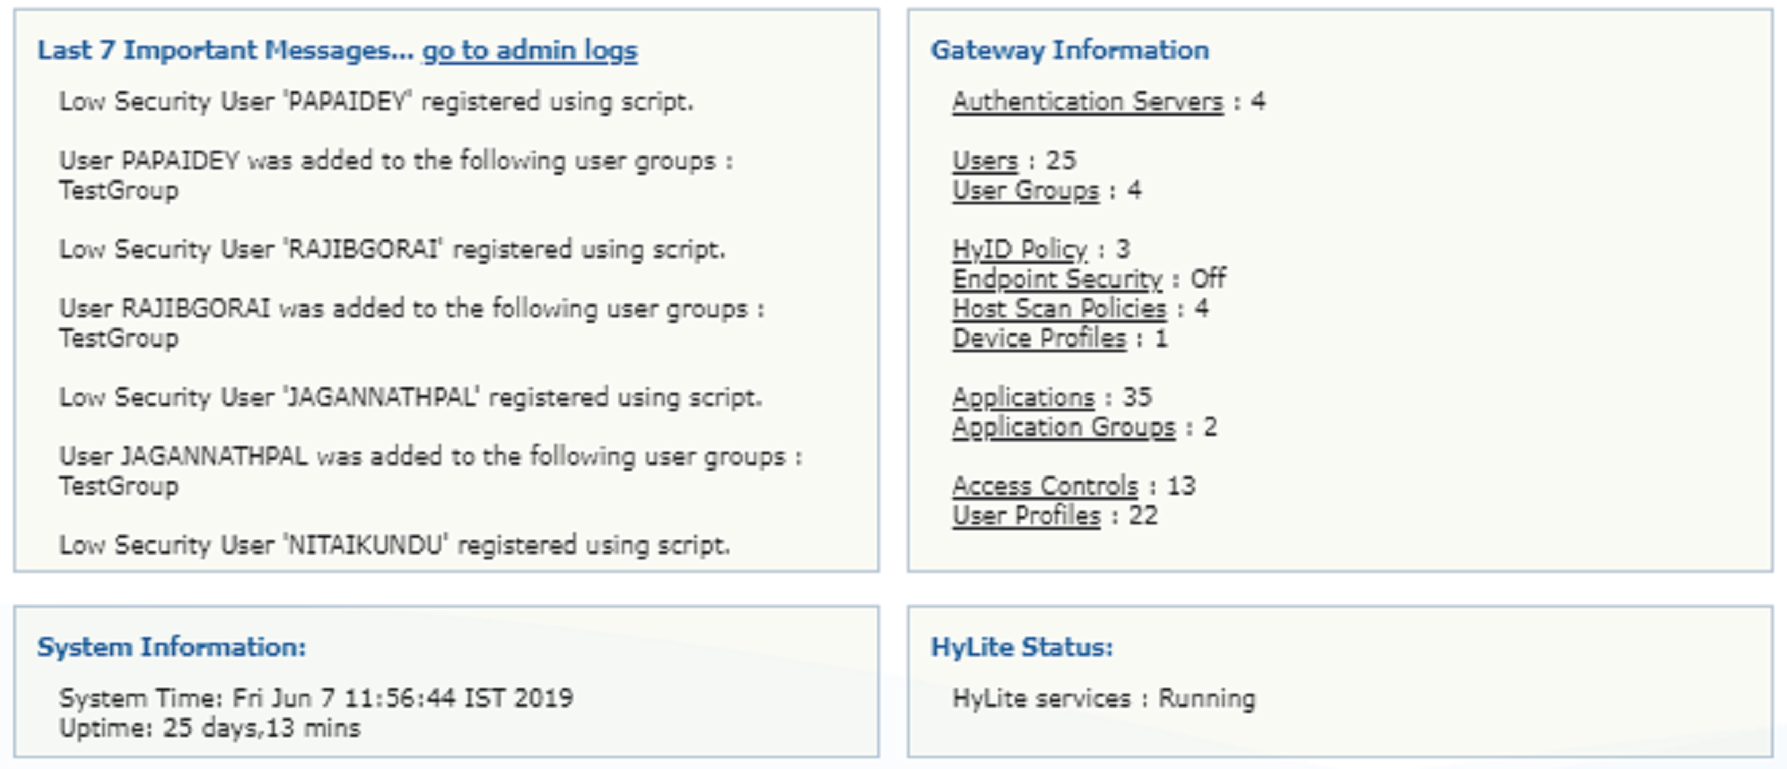
Last 7 administrative events occurring on the HySecure gateway are listed in this widget. A link go to admin logs is also provided to view all the admin logs. For more information, see Admin Logs.
Gateway Information
A summary of key configuration including hyperlinks to specific areas of the HySecure Gateway is listed in this widget.
| # | Configuration | Description |
|---|---|---|
| 1 | Authentication Servers | This displays the number of Authentication servers configured in the system. Clicking on the "Authentication Servers" will display the Authentication Servers page where all authentication servers will be listed. |
| 2 | Users | This would display the number of Local Users configured in the system. Clicking on the "Users" will display the Users page where all local users will be listed. |
| 3 | User Groups | User Groups allows the admin to organize users on the basis of function, logistics or any criteria that suits the organization. This entry displays the number of Local User Groups configured in the system. Clicking on the "User Groups" will display the User Groups page where all local user groups will be listed. |
| 4 | HyID Policy | This entry displays the number of HyID policies (which are used for 2-Factor Authentication) configured in the system. Clicking on "HyID Policy" will display the HyID Policy page where all HyID policies will be listed. |
| 5 | Endpoint Security | This entry displays the number of HySecure Domains for which EPS (EndPoint Security) policies are configured. The numbers are displayed in the form "On Clicking on "Endpoint Security" will display the HySecure Domains page where all configured HySecure domains will be listed along with their respective EPS status. |
| 6 | Host Scan Policies | This entry will display the number of Host Scan policies configured in the system. Clicking on "Host Scan Policies" will display the Host Scan Policies page where all configured Host Scan policies will be listed. |
| 7 | Device Profiles | This entry will display the number of Device Profiles configured in the system. Device Profiles are used to provide appropriate access to devices from which the users log in to the HySecure Gatreway. Clicking on "Device Profiles" will display the Device Profiles page where all configured Device Profiles will be listed. |
| 8 | Applications | This entry will display the number of Applications configured in the system on which typically an Admin will provide relevant access to the users. Clicking on "Applications" will display the Applications page where all configured Applications will be listed. |
| 9 | Application Groups | This entry will display the number of Application Groups configured in the system. Clicking on "Application Groups" will display the Application Groups page where all configured Application Groups will be listed. |
| 10 | Access Controls | This entry will display the number of Access Controls configured in the system. Access Controls are policies configured to define the HySecure and other application access. Clicking on "Access Controls" will display the Access Controls page where all configured Access Controls will be listed. |
| 11 | User Profiles | This entry will display the number of User Profiles which are created whenever a user logs in for the first time. Clicking on "User Profiles" will display the User Profiles page where all created User Profiles will be listed. |
System Information
This widget displays the following information:
-
HySecure Gateway's System time
-
Uptime which indicates the time in days, hours and minutes since last reboot
The above information keeps getting continuously refreshed.
HyLite Status
This widget displays the status of HyLite services as "Running" or "Stopped", as appropriate.
Cluster Node Information
This widget provides information on all the nodes which form part of the cluster. The rows represent each node in the cluster and the various columns indicate the various information about the node. The columns are described in the table below.
| # | Column Name | Description |
|---|---|---|
| 1 | IP | This indicates the IP address of the node through which it can be connected to. |
| 2 | Node Type | This indicates the type of the node being an Active node or a standby. |
| 3 | Services | This indicates whether all services on the node are Running or stopped |
| 4 | Syncing | This indicates whether the Sync daemon is running on this node or not. If the Sync daemon is not running then this node won't be able to sync the configuration. |
| 5 | Load Balancer | This indicates whether the Load Balancer is running on this node or not. |
| 6 | CPU | This indicates the CPU being utilized, in percentage. |
| 7 | RAM | This indicates the RAM being utilized, in percentage. |
| 8 | HDD | This indicates the HDD being used up, as percentage of the total storage available |