Monitoring Cluster Status
The cluster status of the HySecure Management Console can be checked from two sections :
- Dashboard.
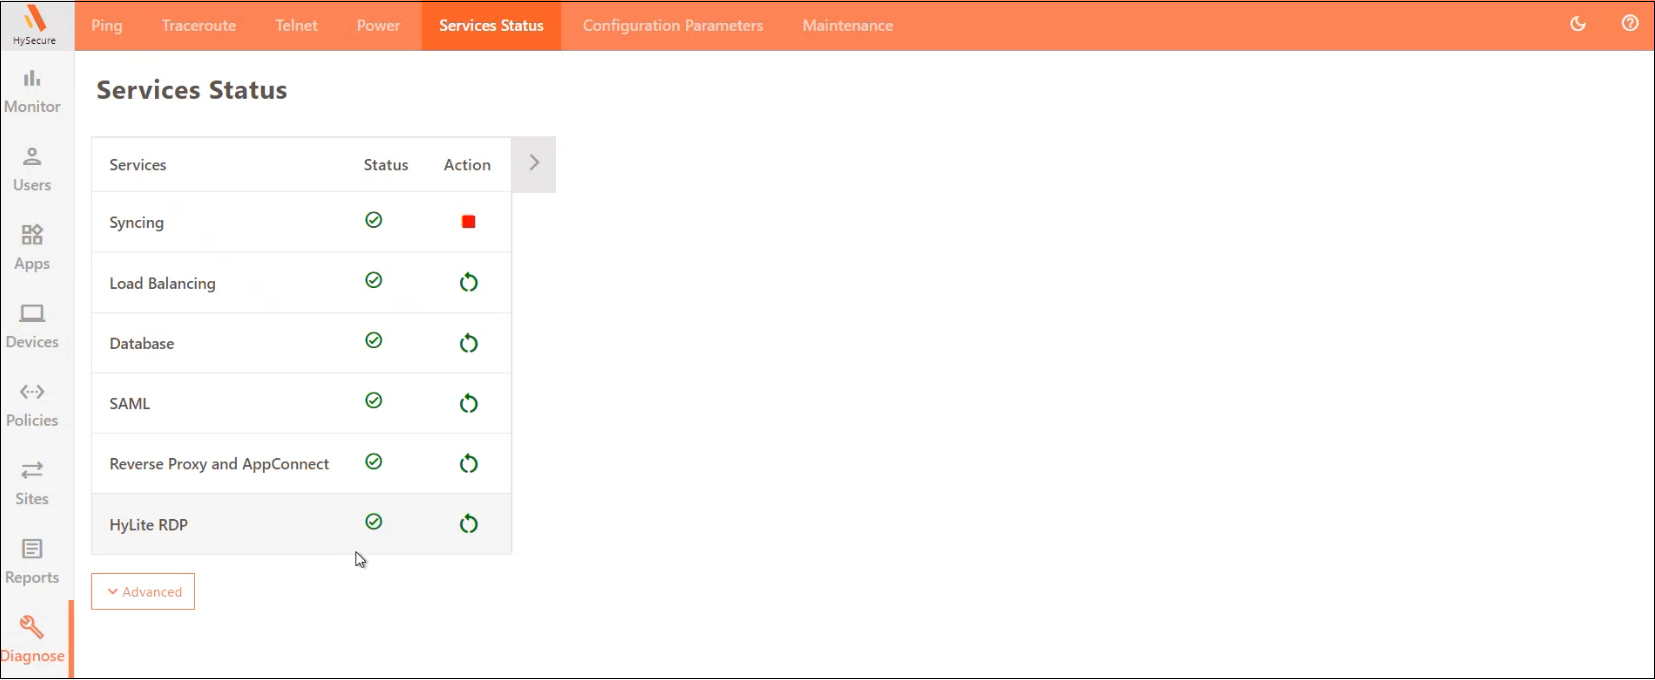
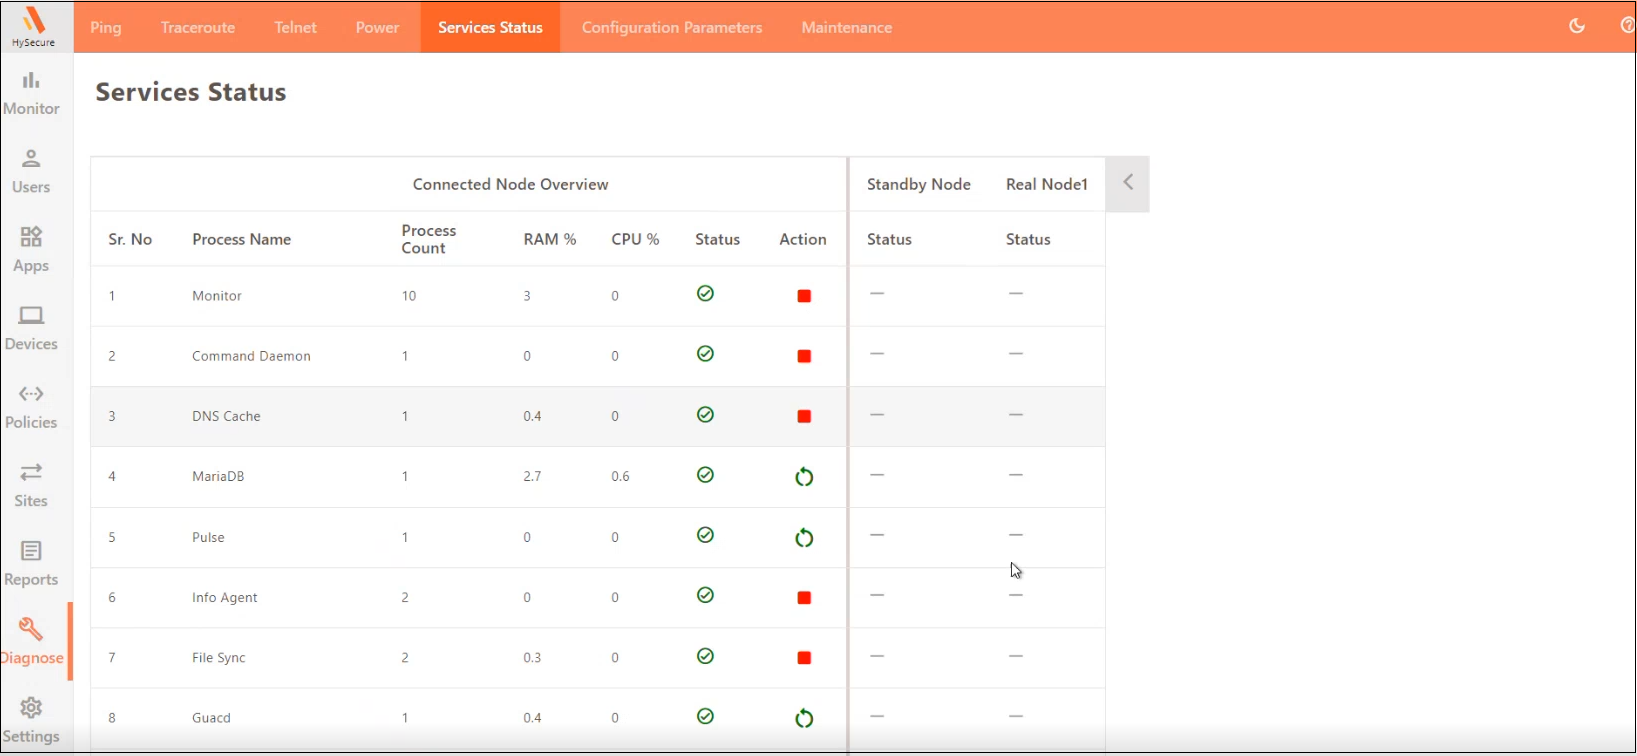
- Navigate to Diagnose > Services Status in the High Availability.
Dashboard - Cluster Nodes Information
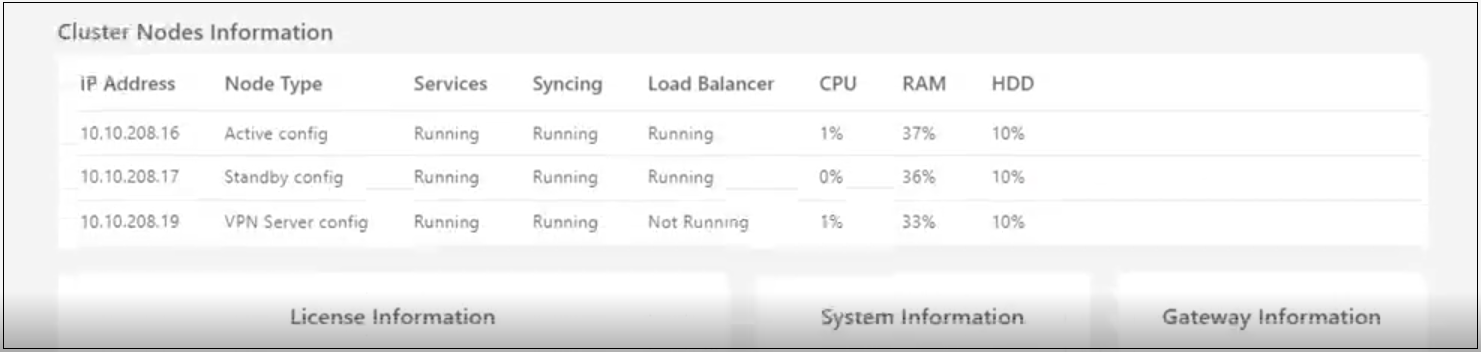
| Field | Description |
|---|---|
| IP Address | Displays the IP Address of Cluster Manager Nodes. |
| Node Type | Displays the Status of the added nodes. |
| Services | Displays the HySecure service status. |
| Syncing | Displays the Data sync service status. |
| Load Balancer | Displays the Load balancer service status. |
| CPU | Displays the CPU utilized on a node. |
| RAM | Displays the RAM utilized on a node. |
| HDD | Displays the Hard disk space utilized on a node. |
Diagnose Services Status in the High Availability.
HySecure Logs
- All the standard logging of HySecure Gateway is seamlessly available across both the cluster manager nodes.
- Administrators can log in to the HySecure Management Console and check all the logs created by all the nodes in the cluster.
- All the nodes in the cluster send their log data to the Active Cluster Manager node in the cluster. The Active Cluster Manager writes the log in a log file as well as sends the same log entry to the standby Cluster Manager.