Dashboard
The Dashboard serves as the default home for the Management Console and provides a real-time view of data and configuration within the HySecure Gateway.
Described below are the various widgets and the information they provide:
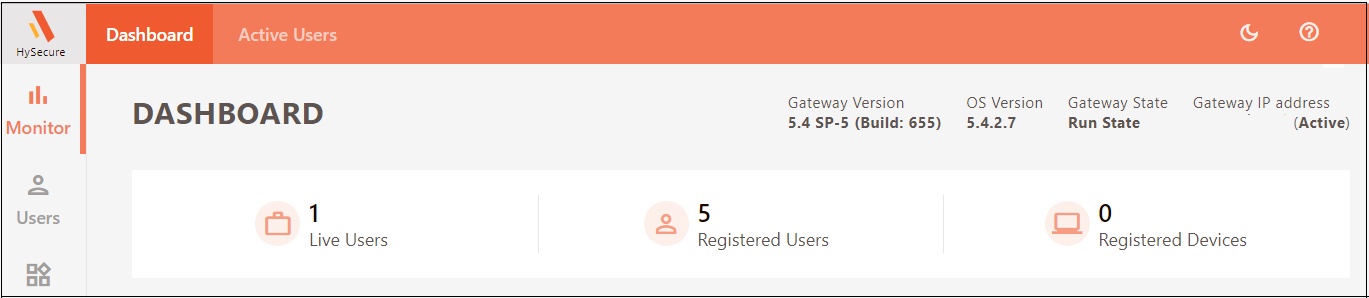
Gateway Status
The initial widget displays the following information:
-
Gateway Version: Displays the last applied Service Pack/Upgrade Patch version.
-
OS Version: Displays the Accops OS version running on HySecure Gateway.
-
Gateway State: Displays the Configuration or Run state; change to Run State to enable end-user login.
-
Gateway IP Address: Displays the HySecure Gateway’s IP Address and the associated status - Active or Standby.
User Status
The following widget provides three types of user statistics:
-
Live Users: This represents the number of users currently logged into the HySecure Gateway. To view the details of the live users, navigate to Monitor > Active Users.
-
Registered Users: This represents the number of users who have logged into the HySecure Gateway at least once and so have a unique profile. To view the details of registered users, navigate to Users > Registered Users.
-
Registered Devices: This represents the number of unique devices used to login into HySecure Gateway. To view the details of registered devices, go to Devices > Access Devices.
User Concurrency Graph
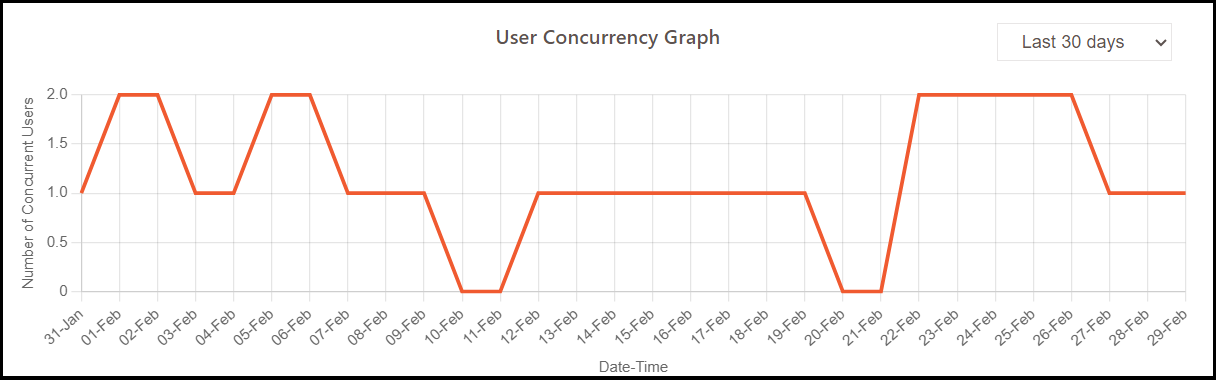
The graph shows max concurrent users for a duration selected from the dropdown options as: 30 days, 7 days, 24 hours.
Distribution of Client Versions
The pie chart displays different client versions in use for the registered devices.
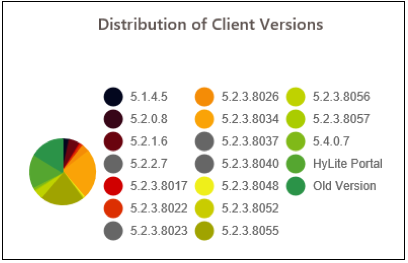
HyLite Portal
Includes devices where clientless users use a web browser to log into the HySecure Gateway.
Old Version
Includes devices running older versions of the HySecure Client that do not send version details.
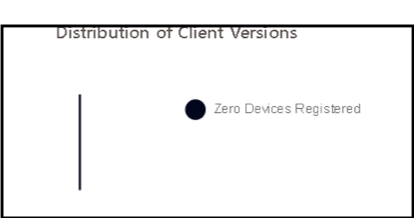
If no devices have been registered, then the Client distribution pie chart will be shown as below:
Average Resource Usage
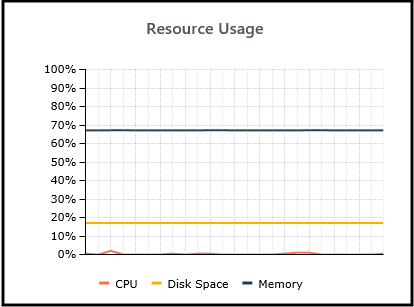
This chart displays the usage of server hardware resources as a percentage of the total available resources, such as the utilization of CPU, disk space, and memory. The chart is updated every 5 seconds.
Cluster Nodes Information
This widget provides information on all the nodes in a cluster. The rows represent each node in the cluster, and the various columns indicate information about the node.
The columns are described in the table below:
| # | Column Name | Description |
|---|---|---|
| 1 | IP | Displays the node’s IP Address for connection. |
| 2 | Node Type | Indicates whether the node is Active or Standby or Real. |
| 3 | Services | Indicates if the node's services are Running or Stopped. |
| 4 | Syncing | Indicates whether the syncing services are running on particular node. |
| 5 | Load Balancer | Indicates whether the load balancer service is operational on the node or not. |
| 6 | CPU | Indicates current CPU usage in percentage. |
| 7 | RAM | Indicates current RAM usage in percentage. |
| 8 | HDD | Indicates the HDD usage in percentage. |
License Information
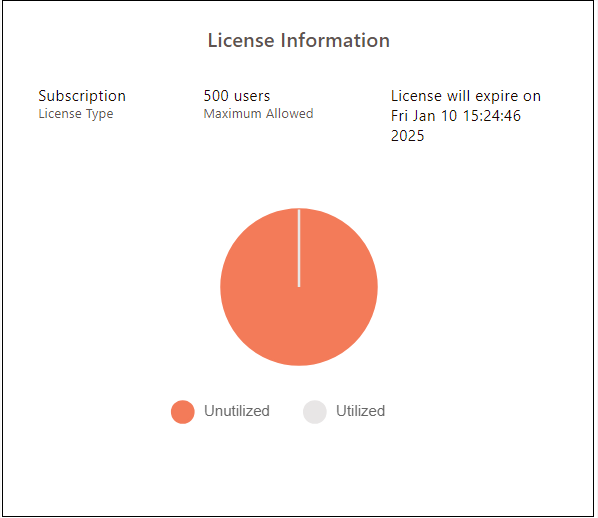
This widget shows the License Type, Maximum Allowed users, and the date and time the License will expire.
It also displays a pie chart showing the license utilization.
System Information
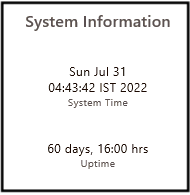
This widget displays:
-
HySecure Gateway system time.
-
Uptime: Indicates the time in days, hours, and minutes since the last reboot.
The information mentioned above is continuously updated.
Gateway Information
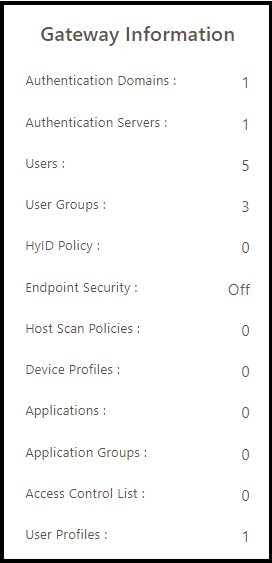
This widget displays the summary of various HySecure Gateway configurations at a glance. It also has hyperlinks to specific areas of the HySecure Gateway.
| No. | Configuration | Description |
|---|---|---|
| 1 | Authentication Domains | Displays the number of authentication domains defined by the administrator in the system. Click to view the list of configured authentication domains. |
| 2 | Authentication Servers | Displays the number of authentication servers configured in the system. Click to view the complete list of configured authentication servers. |
| 3 | Users | Displays the number of local users configured in the system. Click to view the list of local users. |
| 4 | User Groups | Displays the number of local user groups configured in the system. Click to view the list of local groups. |
| 5 | HyID Policy | Displays the number of HyID policies (used for Multi-Factor Authentication) configured. Click to view the list of all the HyID policies. |
| 6 | Endpoint Security | Displays the number of HySecure Domains for which EPS (End-Point Security) policies are configured. The numbers are displayed in the form “ <Number of HySecure Domains for which EPS policies are enabled> / <Total HySecure Domains present in the system>” Selecting it displays the page listing all the configured HySecure Domains and their respective EPS status. |
| 7 | Host Scan Policies | Displays the number of Host Scan policies configured in the system. Click to view the list of all the configured host scan policies. |
| 8 | Device Profiles | Displays the number of Device Profiles configured in the system. Click to view the list of all the device profiles. |
| 9 | Applications | Displays the number of applications configured in the system. Click to view all the configured applications. |
| 10 | Application Groups | Displays the number of application groups configured in the system. Click to view all the configured application groups. |
| 11 | Access Controls | Displays the number of configured Access Control policies list that define access to HySecure and other applications. Click to view the list of all the access control list. |
| 12 | User Profiles | Displays the number of registered user profiles, created at the time when the user logged in for the first time. Click to view the list of all the registered users. |
HyLite Status
This widget displays the status of the services responsible for HyLite Portal whether they are Running or Stopped..