ARS Dashboards
Dashboards
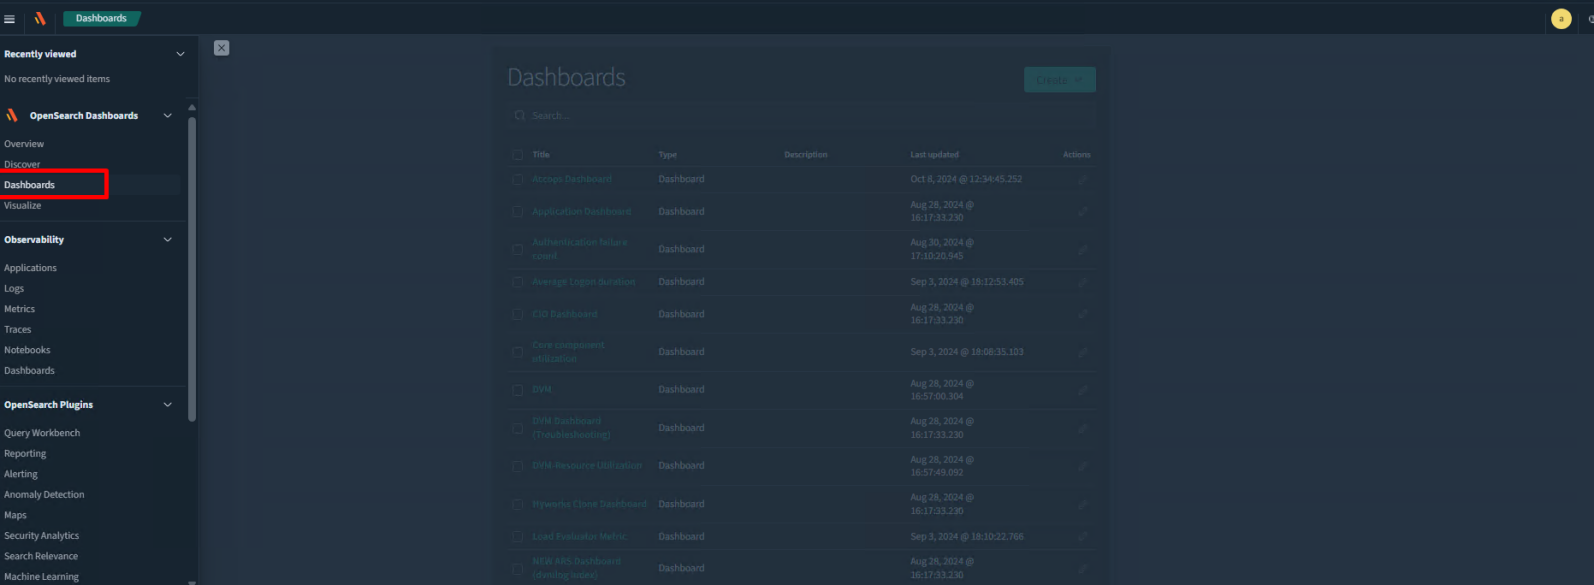
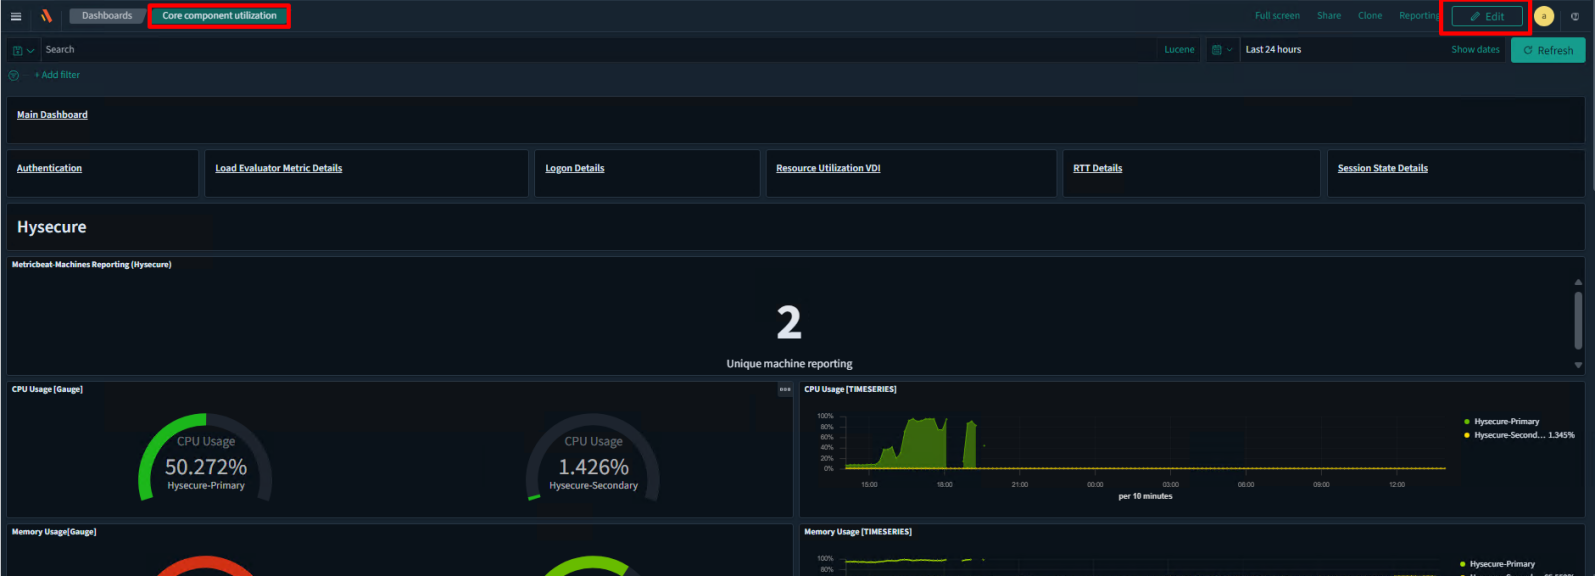
Dashboards are collections of visualizations designed to help you view and analyze data collected from our products. Pre-configured dashboards are available on the ARS platform for your convenience. To access them, please follow these steps:
-
Log in to the ARS server.
-
Select the Dashboard tab from the left panel.
-
Click on the link for the appropriate dashboard you wish to view.
-
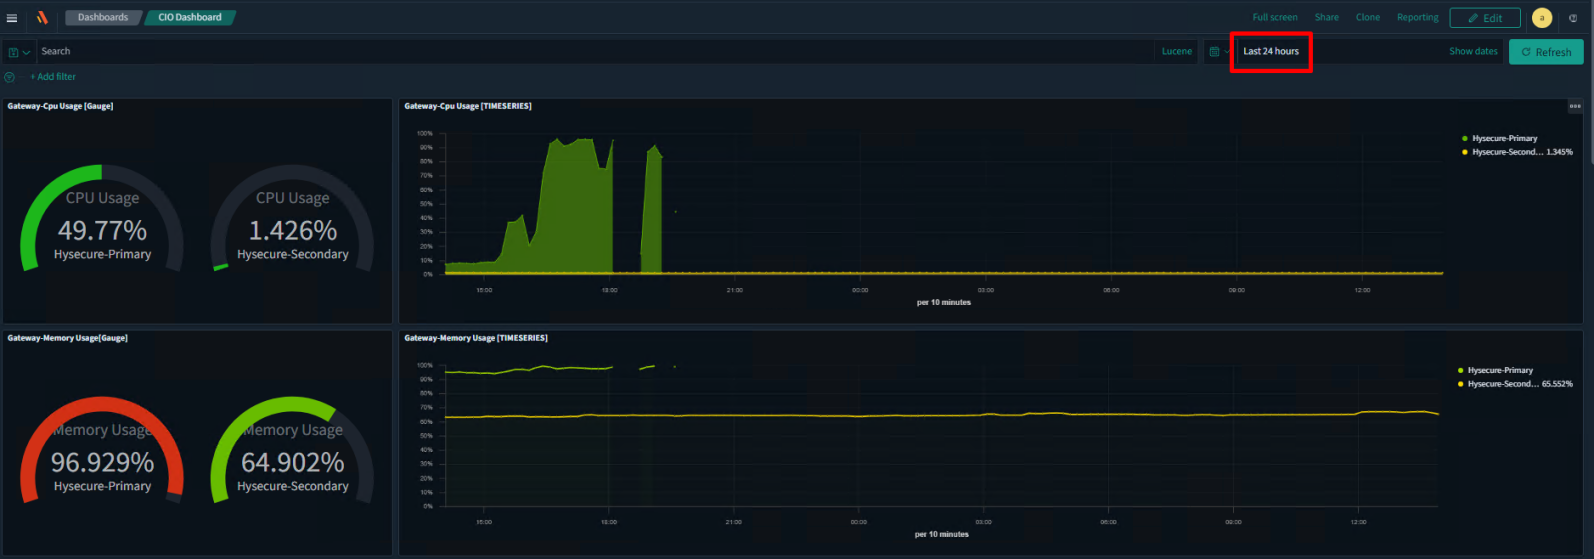
When you click on a dashboard, all the visualizations within that dashboard will request and extract data from the underlying database to display the information. By default, a time period of 24 hours is selected for the dashboards. You can change this by selecting a different time frame using the time picker located in the top right corner.
-
Upon changing the time period, all the visualizations will reload the data based on the new time frame. If you select a large time frame, such as 6 months/ 1 year or more, please give a few minutes for the dashboard to reload.
-
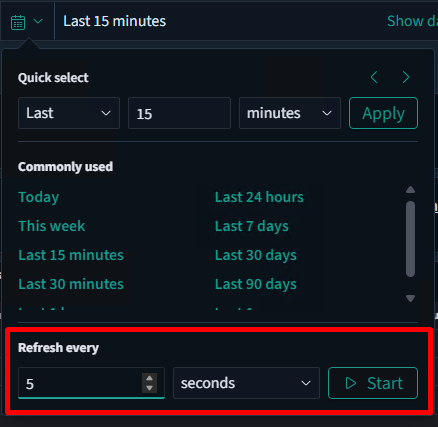
You can configure the dashboard to refresh at regular intervals to display the most current data for monitoring. To set the desired auto-refresh period, specify the required time settings (such as 5 seconds or 1 minute) and select Start. To stop the auto-refresh, simply click Stop.
Frequently Asked Questions (FAQ)
-
How to change the names of Visualizations & Dashboards?
To change the default names of Visualizations & Dashboards, follow the steps below:
-
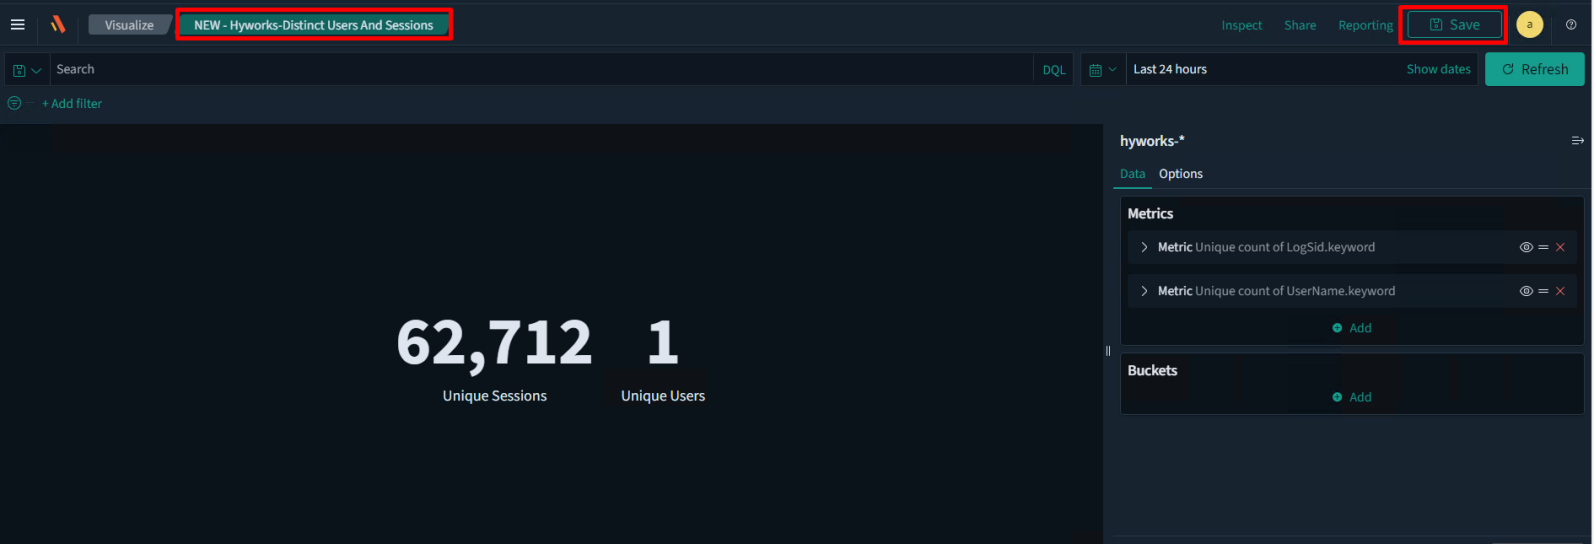
Make a note of the name of the Visualization whose name you’d like to change.
-
Go to the Visualize tab & use the search box to locate the visualization.
-
Click Save at the top right and replace the default name with the name you want to give. Once finished, click Save. The new name will now reflect on the dashboard.
-
Go to the Dashboards section in the left pane and select the dashboard that you want to edit.
-
Click Save at the top right and proceed to change the name/description given to the dashboard. Click Save to apply.
-
-
Why does the Discover tab display No results found when I log in to the server?
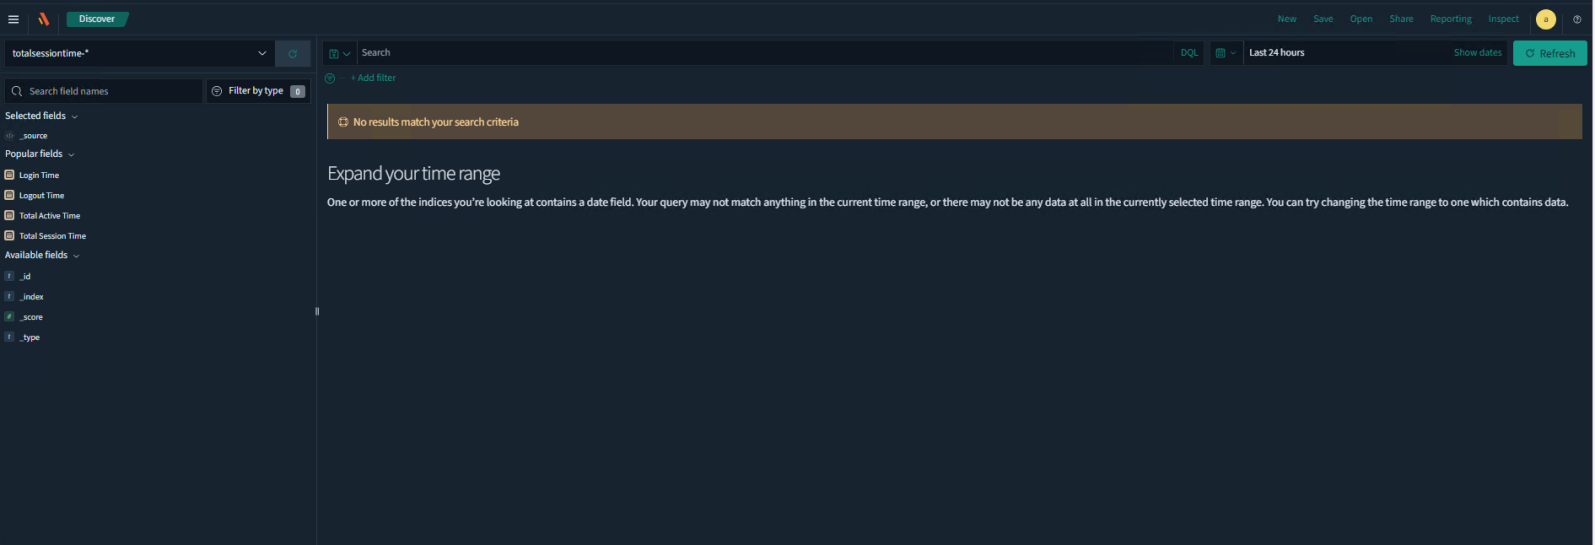
If you see this message, the following possibilities could cause this:
-
If the index selected is HySecure or HyWorks, the logs parsing service may be down.
-
No activity/logs produced by the servers (very rare).
-
In the case of the HySecure index, the log shipping agent (filebeat) may not be operational.
-
In the case of the HyWorks index, the syslog settings may have been reset.
-
In case all the settings are correct at the end of HySecure/HyWorks, but still not getting any logs.
The following are the possible solutions for the above causes:
-
If the index selected is HySecure or HyWorks, the logs parsing service may be down:
-
Log in to the ARS server via Putty using root credentials.
-
Run command > ps -ax | grep logstash.
-
If the process ID is generated > kill -9 pid (kill process id) and start logstash (If the process ID is not generated directly, start the logstash).
-
Tail the logstash logs (tail -f/var/log/logstash/logstash-plain.log) and check if TCP 5044 is in LISTEN state (netstat -ant | grep 5044).
-
Once done, refresh the ARS web UI and check again.
-
-
No activity/logs produced by the servers (very rare)
It is highly unlikely for this scenario to pan out, especially if the time period is 24 hours. Simulate a successful login to the gateway/controller and refresh the web UI to try again. In the case of the HySecure index, the log shipping agent (filebeat) may not be operational.
-
Log in to the HySecure gateway via PuTTY.
-
Check the status of the filebeat service (systemctl status filebeat).
-
Check if there is any activity on TCP 5044 (netstat -ant | grep 5044).
-
If you find that there is no activity on TCP 5044 & the service is not running, restart the filebeat service (systemctl restart filebeat).
-
Wait for a few minutes and reload the ARS web UI.
-
-
In the case of the HyWorks index, the syslog settings may have been reset.
-
Log in to the HyWorks Management console as an administrator.
-
Navigate to Host Management > Syslog Config and ensure that the correct ARS server IP address is provided under the Remote Address field. Also, ensure that the value of the Identity field matches the one given during ARS installation.
-
Once set/verified, reload the ARS web UI and check again.
Note
The IP address & Identity value may get reset in case of a HyWorks Controller upgrade. Please make a note of the details entered here and re-enter them after the upgrade is complete.
-
-
In case all the settings are correct, but still not getting any logs.
- Check the timedatectl for both the servers, as it's mandatory to have the same date and time for the servers to get logs.
-
-
Why are the CPU/Memory usage-related graphs not getting updated?
-
Log in to the HySecure/HyWorks server via Putty/mstsc, for which the data is not getting updated.
-
In case of Linux – systemctl restart Metricbeat.
-
In case of Windows – Restart the metricbeat service from Start > Run > services.msc
-
-
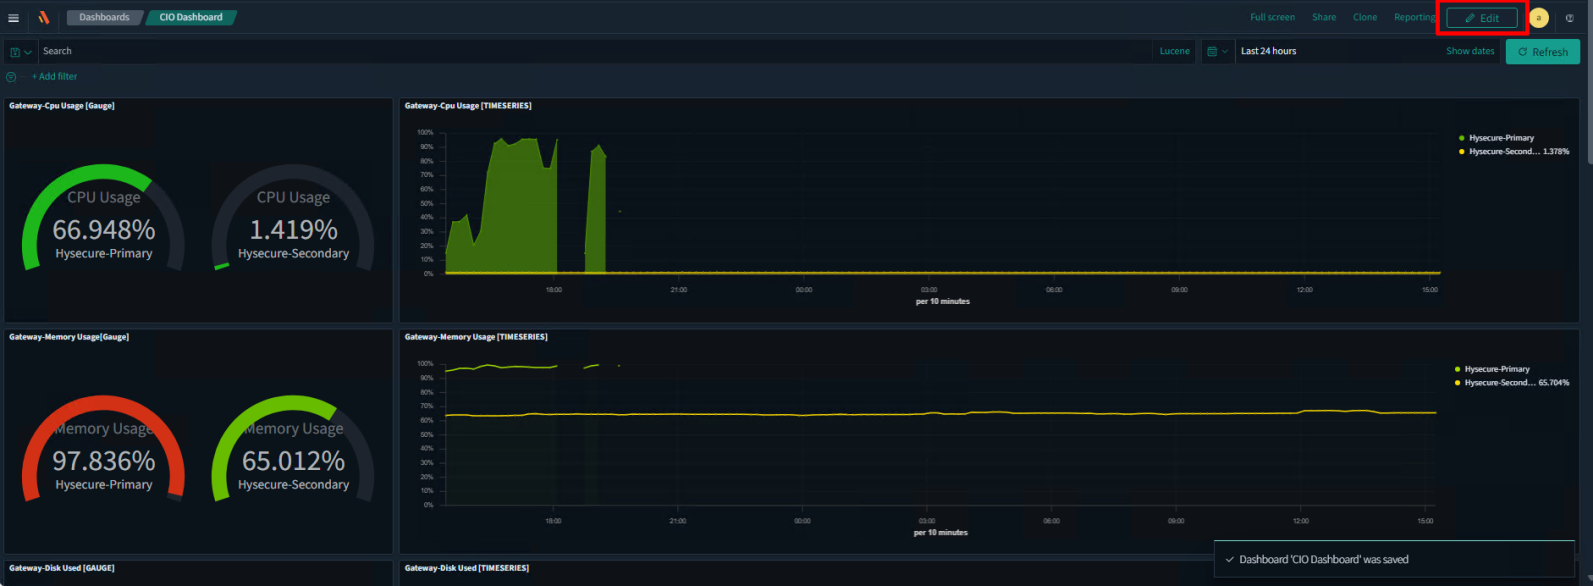
Can I resize/move the Visualizations in the Dashboard?
Yes, you can. Follow the steps below:
-
Log in to ARS Web UI and open the appropriate Dashboard.
-
Click on Edit in the top right.
-
Hover your mouse on the visualization name (sample areas marked in red below) until you get a 4-way arrow symbol.
-
Move the visualization by continuing to hold the left mouse button.
-
Once moved to the new location, release the left mouse button.
-
Click on Save in the top right to save the Dashboard.
-
Once done, click on Save located at the top right bar to save the dashboard with the new sizes.
-
-
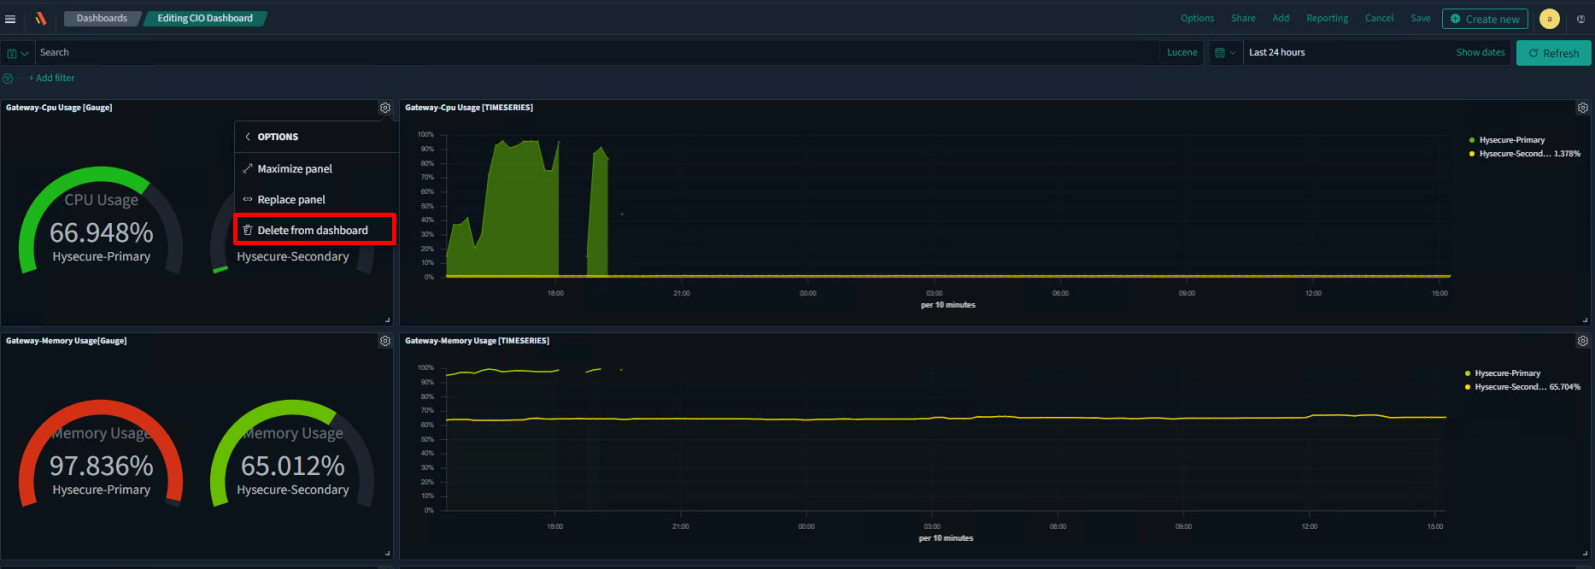
Some visualization dashboards are not relevant to my setup and do not display any data. Can I delete them?
Yes, you can. Delete any visualization part of dashboards by following the steps below:
-
Log in to ARS Web UI and select the appropriate Dashboard wherein you’d like to make changes.
-
Click Edit to make changes.
-
Locate the visualization you want to remove from the dashboard and click the gear icon.

-
Click on Delete from Dashboard to remove the visualization from the dashboard.
-
Click Save to save the new dashboard setting.
-
Steps to Reload ARS Core Services
Follow the steps below to reload all the ARS core services:
-
Reload OpenSearch
-
systemctl stop opensearch
-
systemctl start opensearch
-
netstat -ant | grep 9200
-
-
Reload Opensearch Dashboards
-
systemctl stop opensearch-dashboards
-
systemctl start opensearch-dashboards
-
netstat -ant | grep 5601
You may also use systemctl restart opensearch/opensearch-dashboards as an alternative:
-
Reload Logstash
-
ps -ax | grep logstash
-
Locate the PID of the logstash process
-
kill -9 PID_OF_LOGSTASH_PROCESS
-
sh/etc/logstash_start.sh
-
netstat -ant | grep 5044 (wait for 5 minutes before running this)
-