Accessing ARS Web UI
ARS consists of the following components:
- Log Parser
- High-Performance Storage Database
- ARS Web UI
ARS Web UI
-
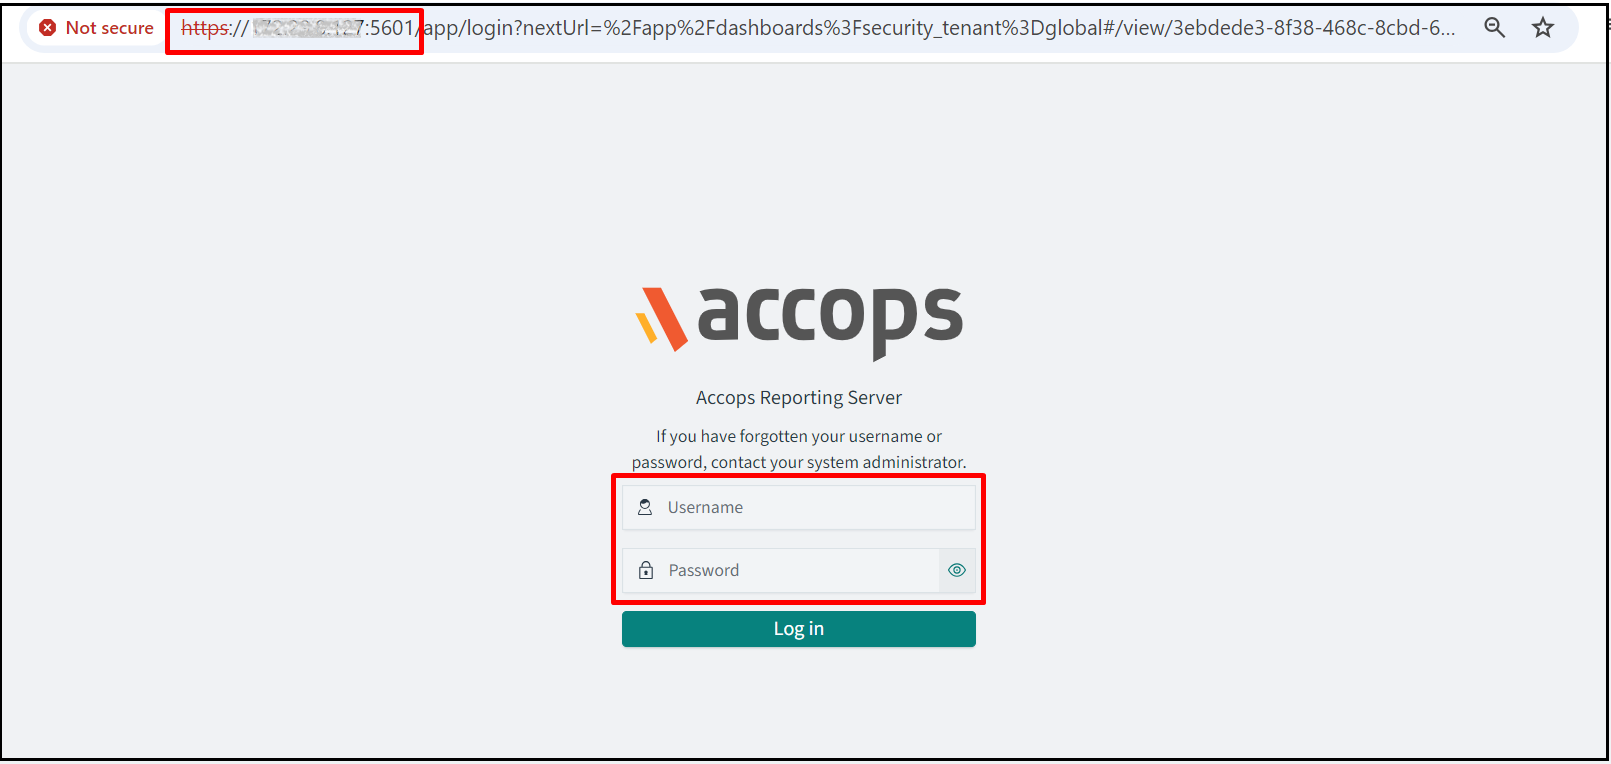
Access the ARS Web UI by opening the web browser and navigating to the URL https://
-
When prompted for credentials, enter the default credentials.
-
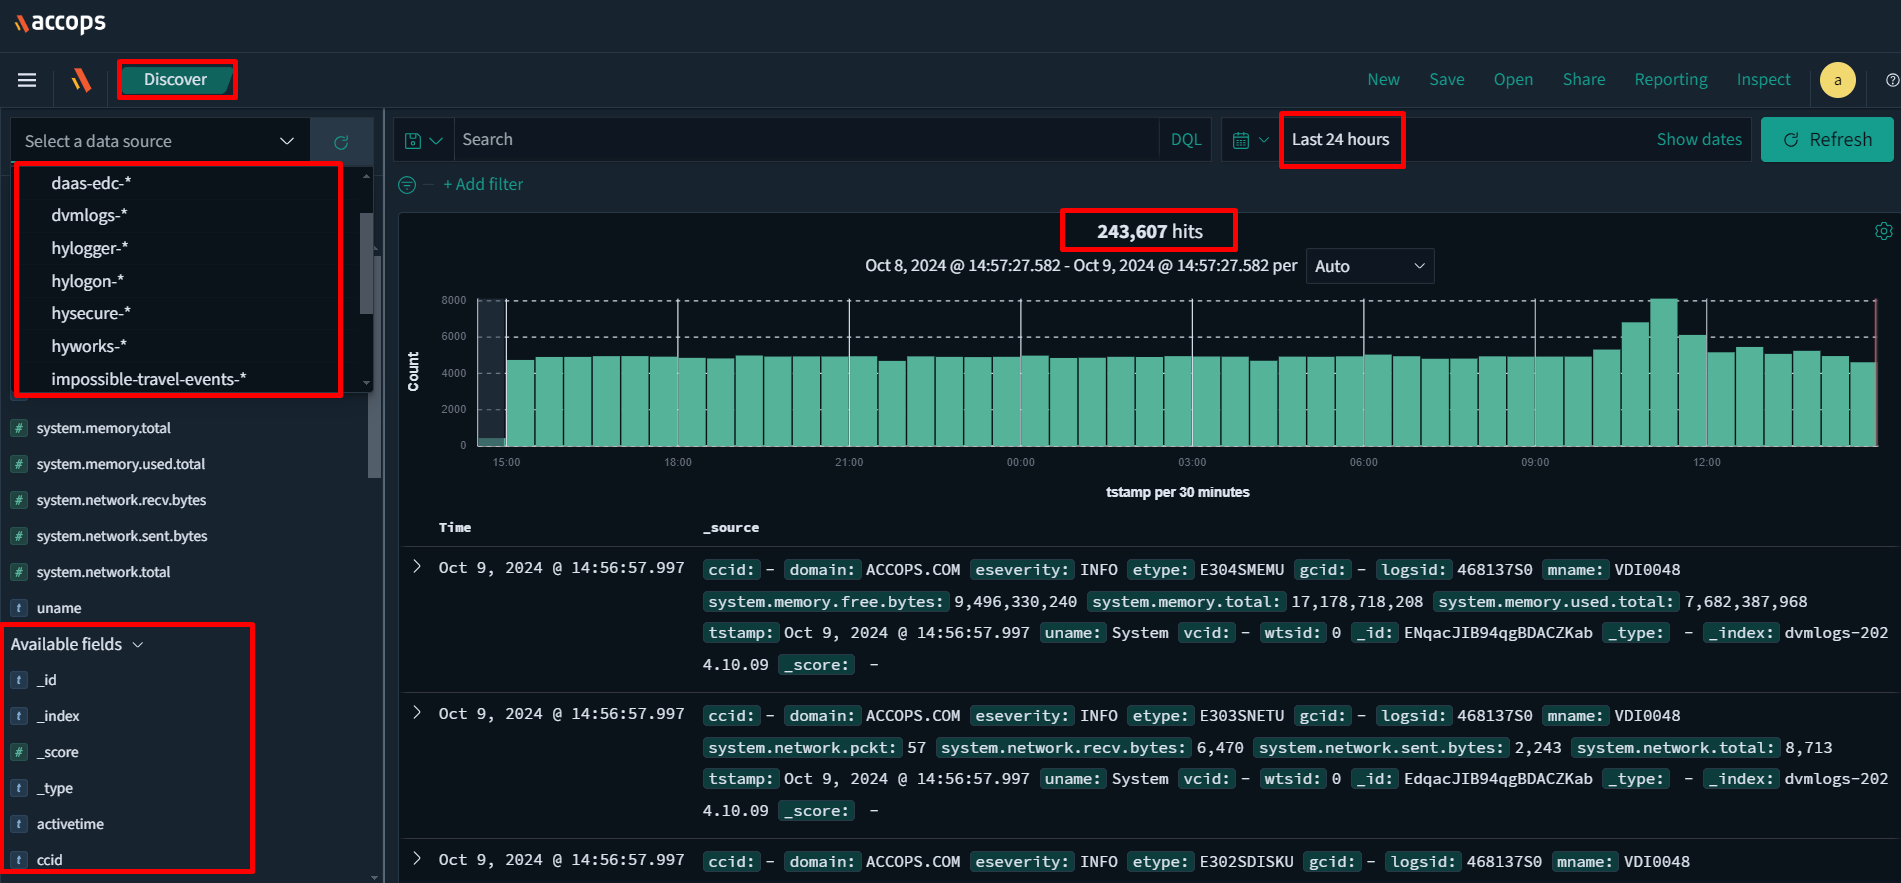
Upon successful login, the web UI will open the Discover Tab.
The most important sections of the UI are listed below:
-
Discover: This section shows all logs received from log shipping agents after they have been parsed into their corresponding fields. This is the default view displayed upon logging into the web UI.
-
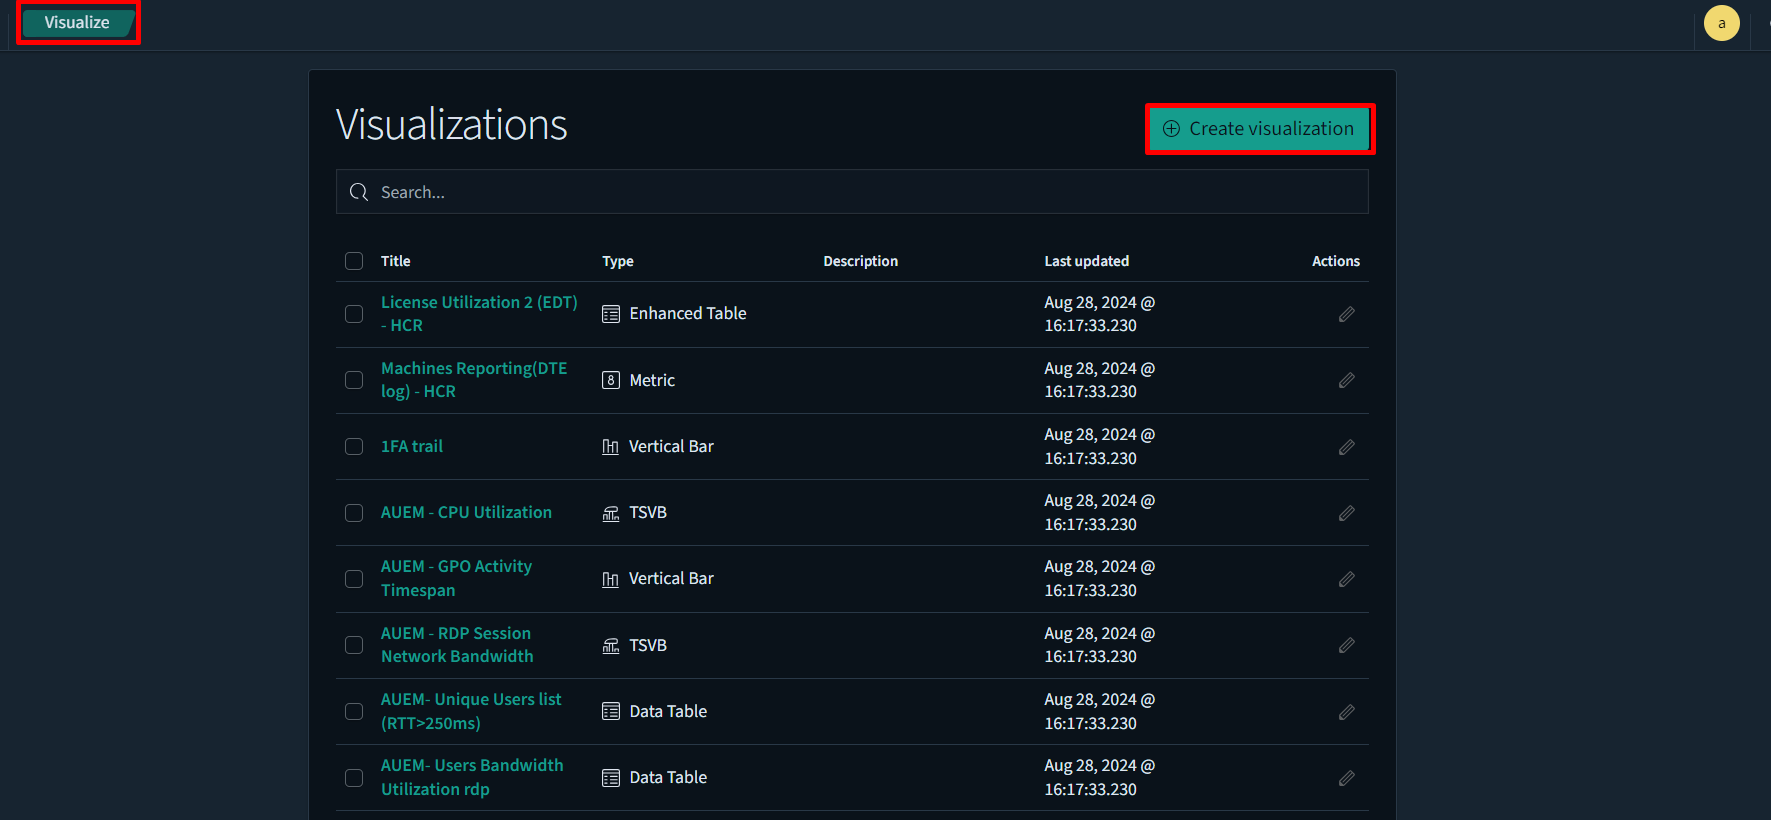
Visualize: This tab is used to add or edit the visualizations. Click + Create Visualization to add a new visualization. You can edit existing visualizations by clicking the respective link or using the search bar to find a specific one.
-
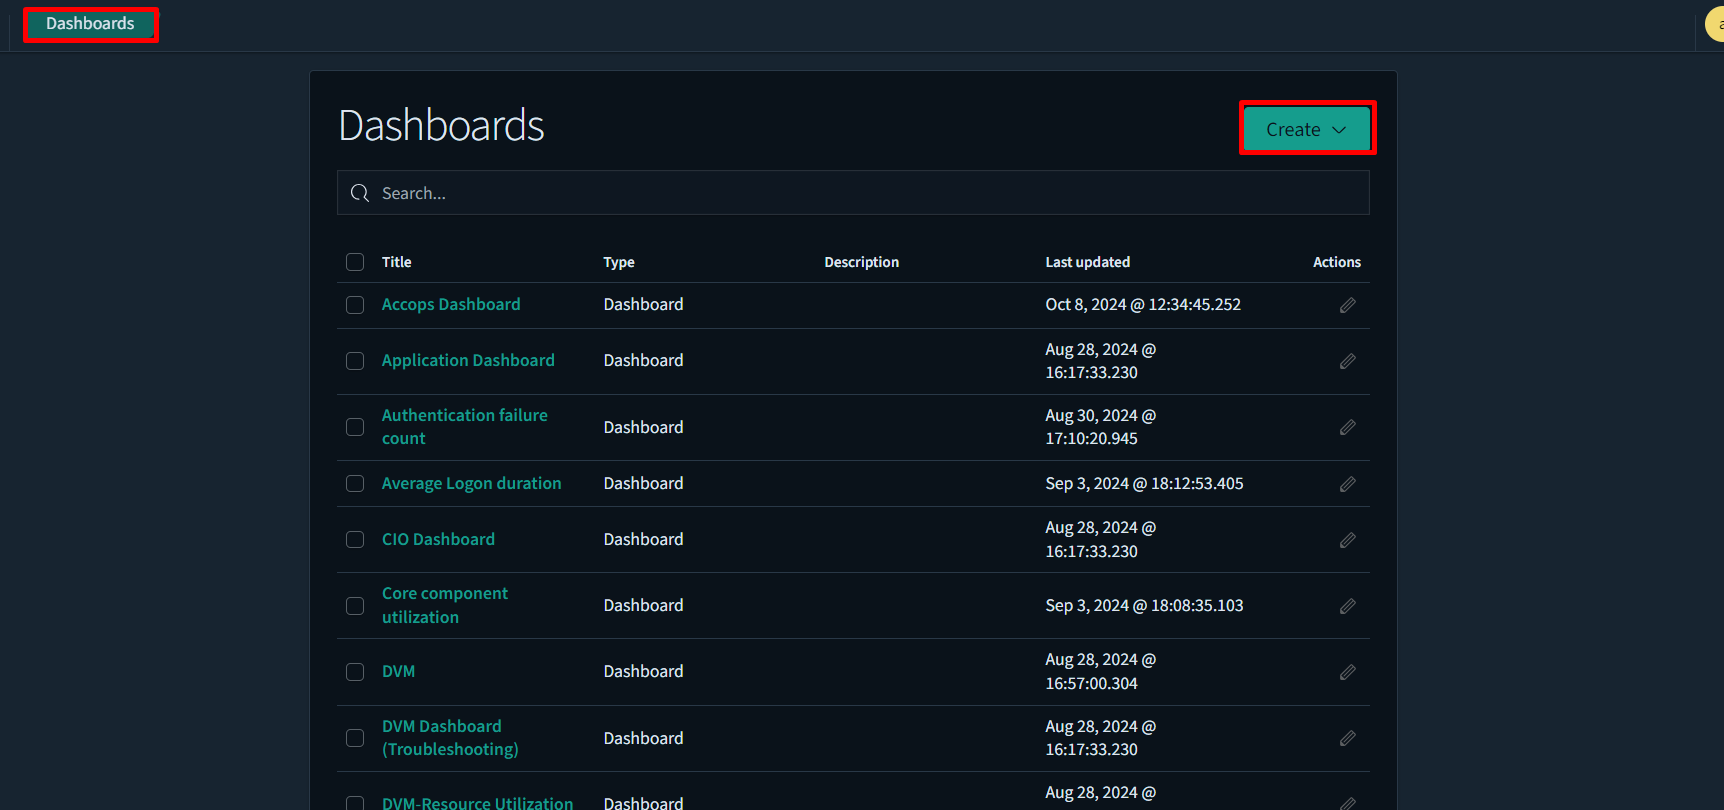
Dashboards: It is a collection of multiple visualizations displayed together. This tab lists all the pre-configured dashboards available to view.
-
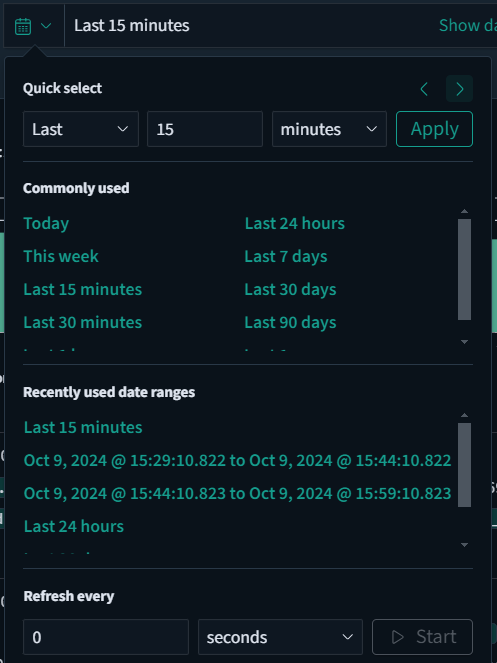
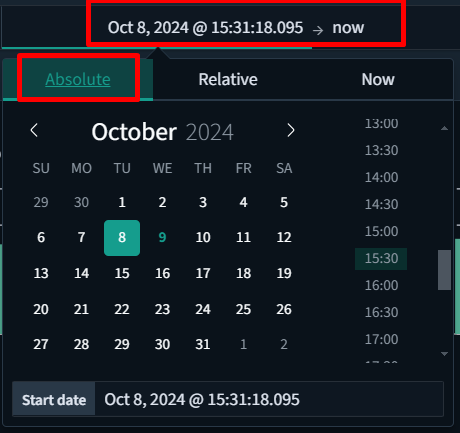
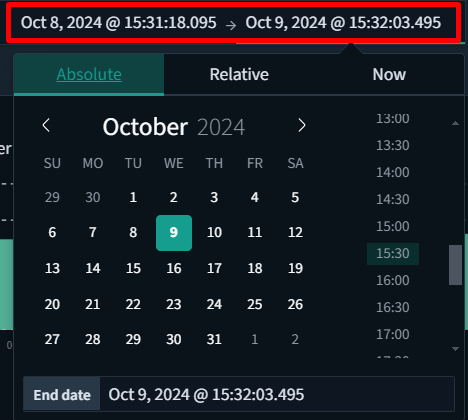
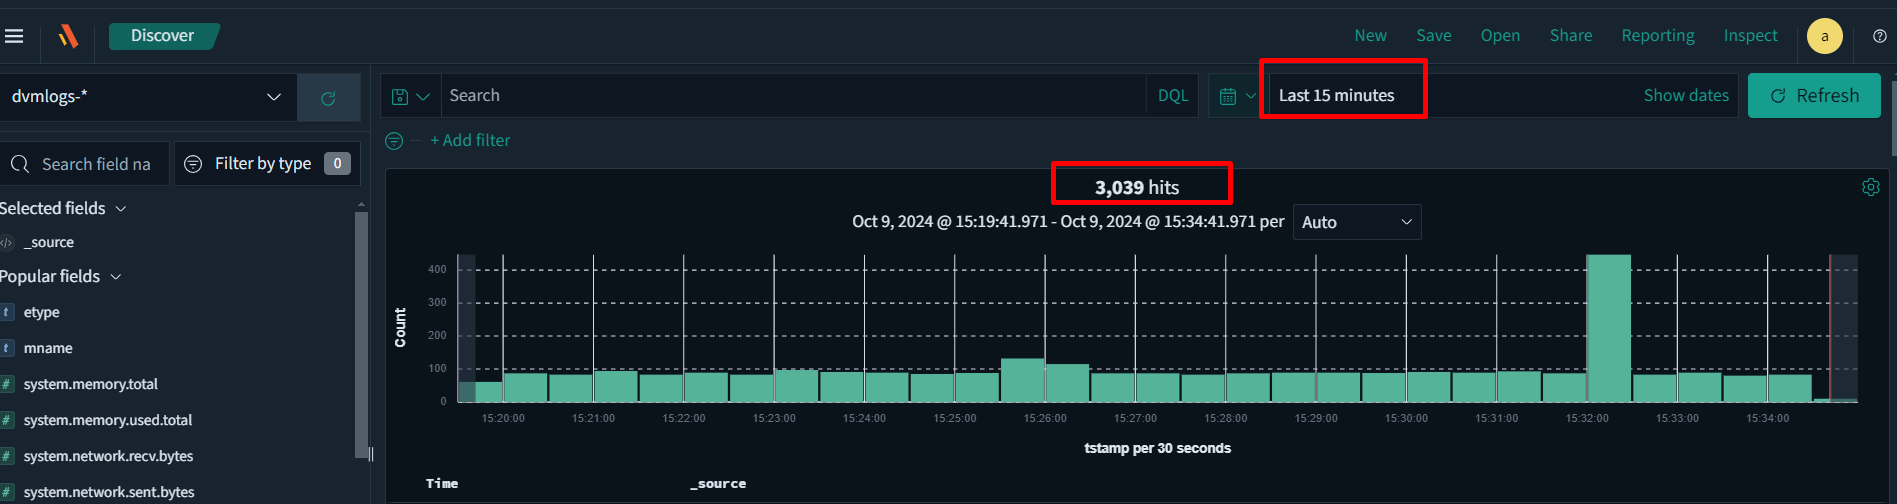
Time Picker: Select the time picker on the top right corner to set the time period for which you wish to view logs. The default time period is 15 minutes. You can change this to last hour, last 1 day, last 7 days, etc, or absolute by providing the exact time range.
-
Log Count: The total number of logs that match a given filter or time period is displayed in the top centre (e.g., 3039 hits). In this case, since no filters were applied and a time window of the last 15 minutes was selected, a total of 3,039 log records were found and are being displayed.
-
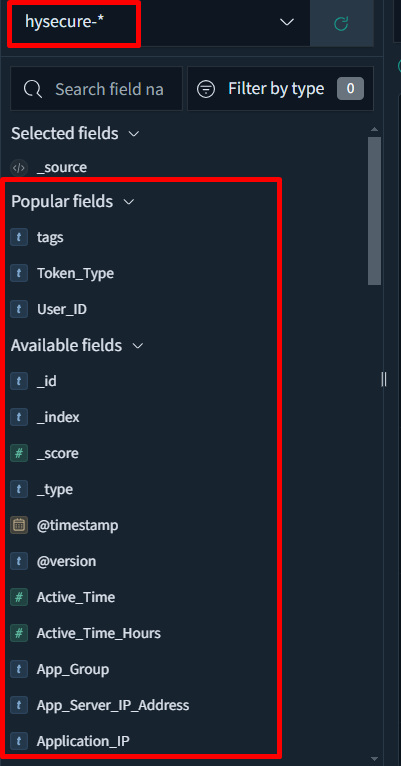
Fields: Raw logs are processed by the parser and mapped to the relevant fields as defined internally. The list of all detected fields for the specified time period is displayed on the left. Hover over a field and click Add to create an ad-hoc report based on a selected set of fields. For example, we have selected the HySecure- index to display data from the HySecure Client, and the Available Fields* section lists some of the reported fields.
-
Add a Filter: This section can be used to extract specific events based on the given input query. The following types of information can be used to make queries:
-
Tags (configured to be appended for certain events)
-
Fields
The list of tags and fields with their meanings is provided in Appendix A. They may be used to extract the required data from the database.
The following examples are provided as a guide for extracting data:
Scenario: For instance, to extract the list of successful logins to the HySecure Gateway for the last 7 days, follow the steps listed below:
-
Log in to the ARS Web UI.
-
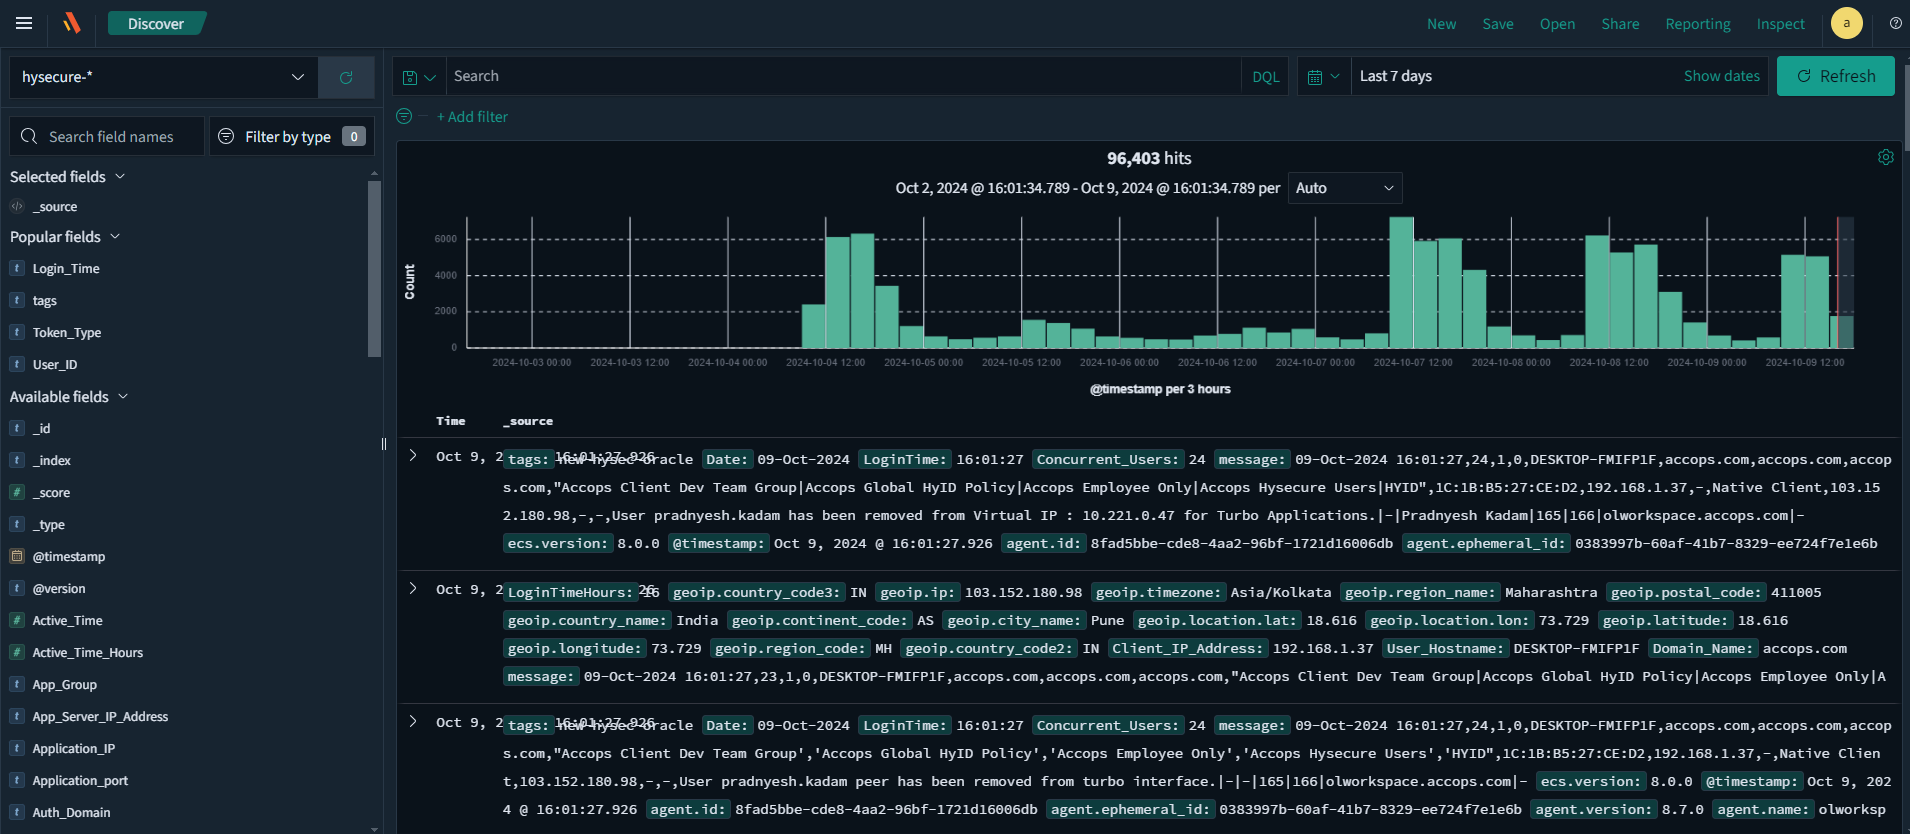
Navigate to the Discover tab, select HySecure using the index picker to view the HySecure logs.
-
Navigate to the time picker in the top right corner to change the period to last 7 days.
-
Click + Add Filter.
-
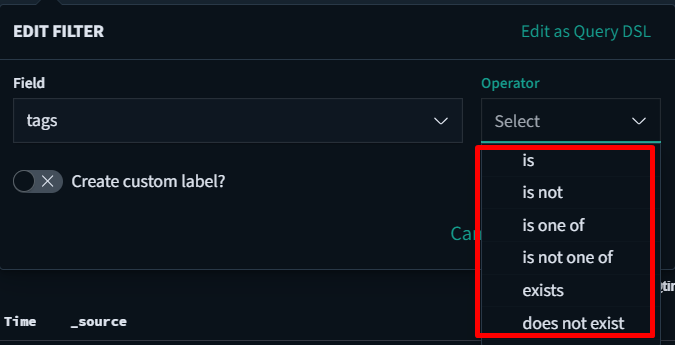
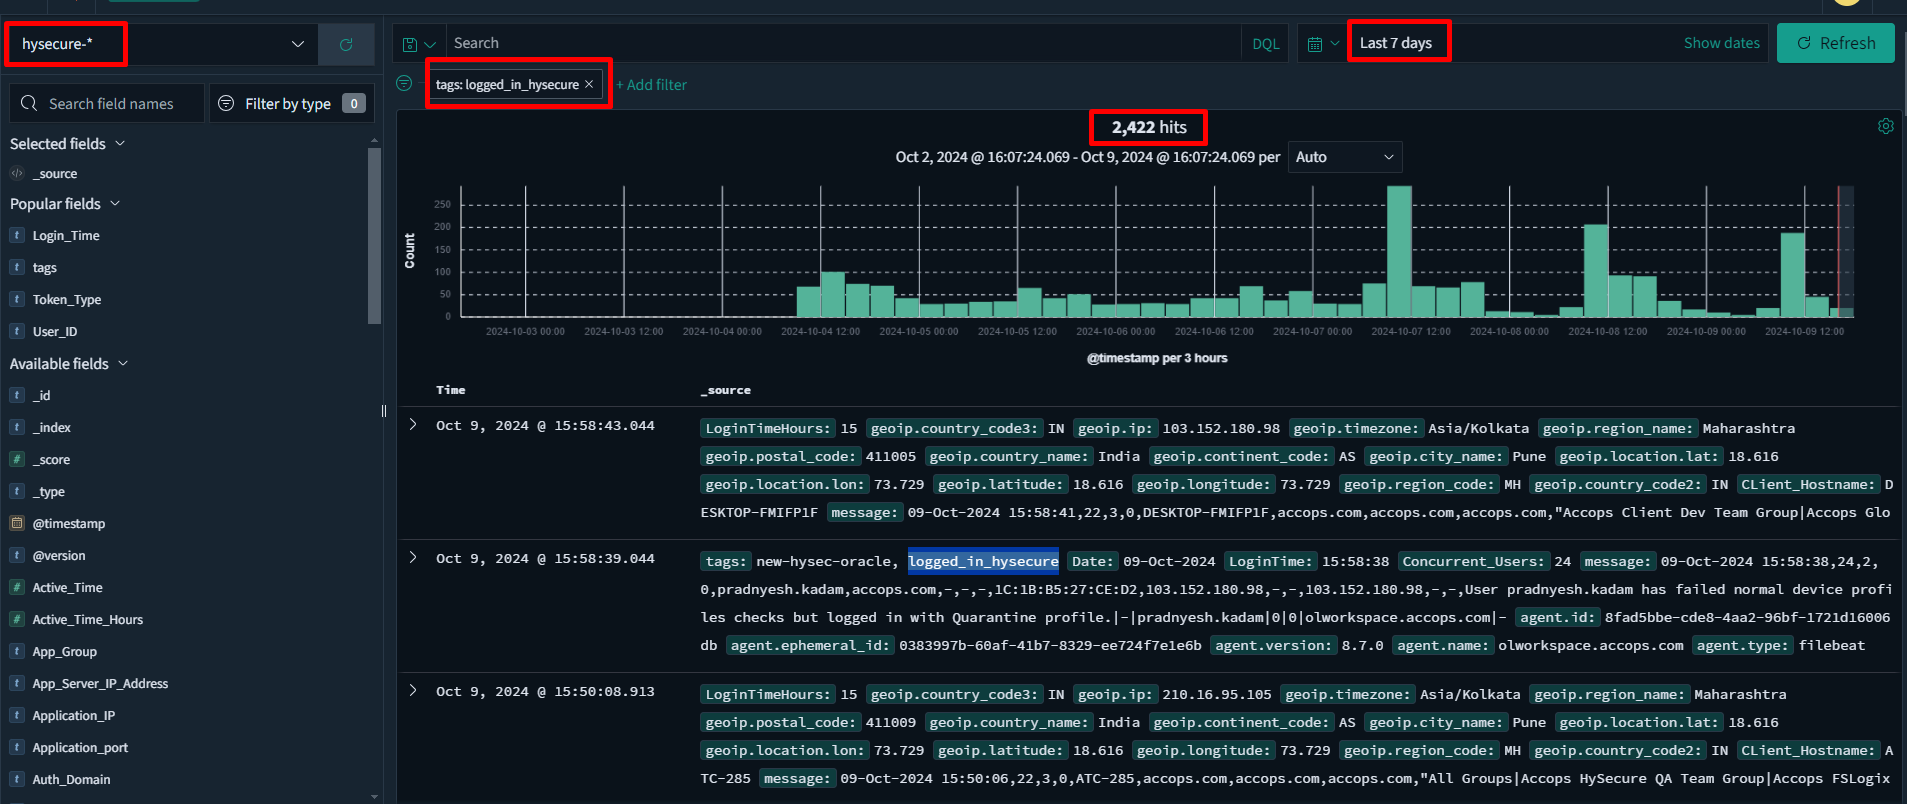
A tag named logged_in_hysecure is added to every log event containing a successful login. Select tags in the filter Field.
-
Select is as the Operator and type logged_in_hysecure as the Value.

-
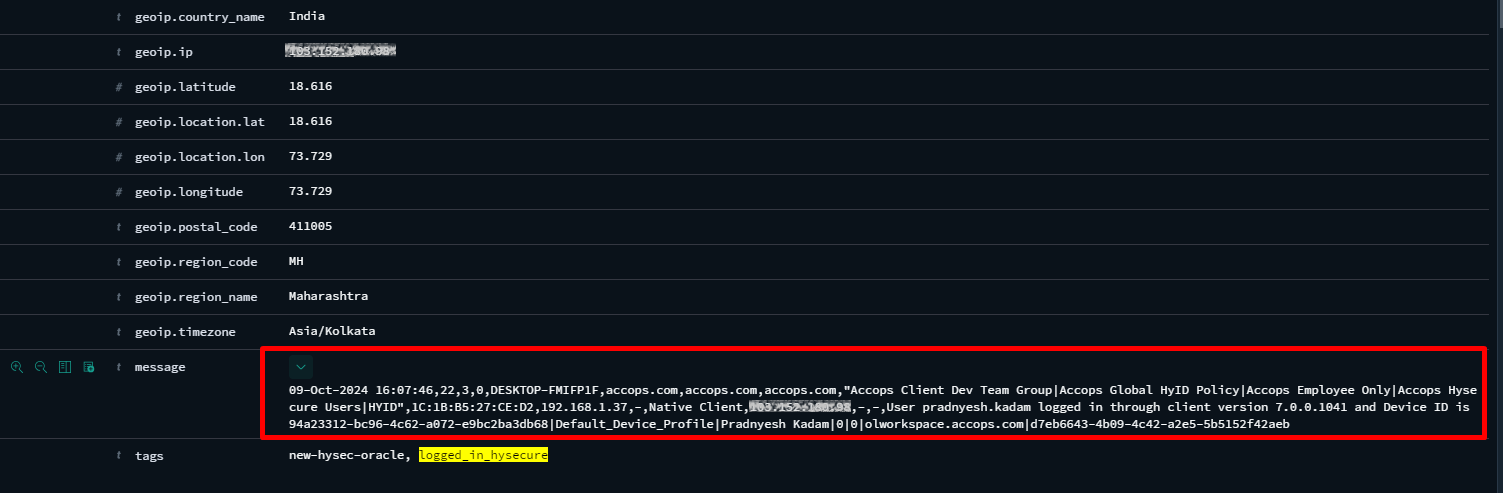
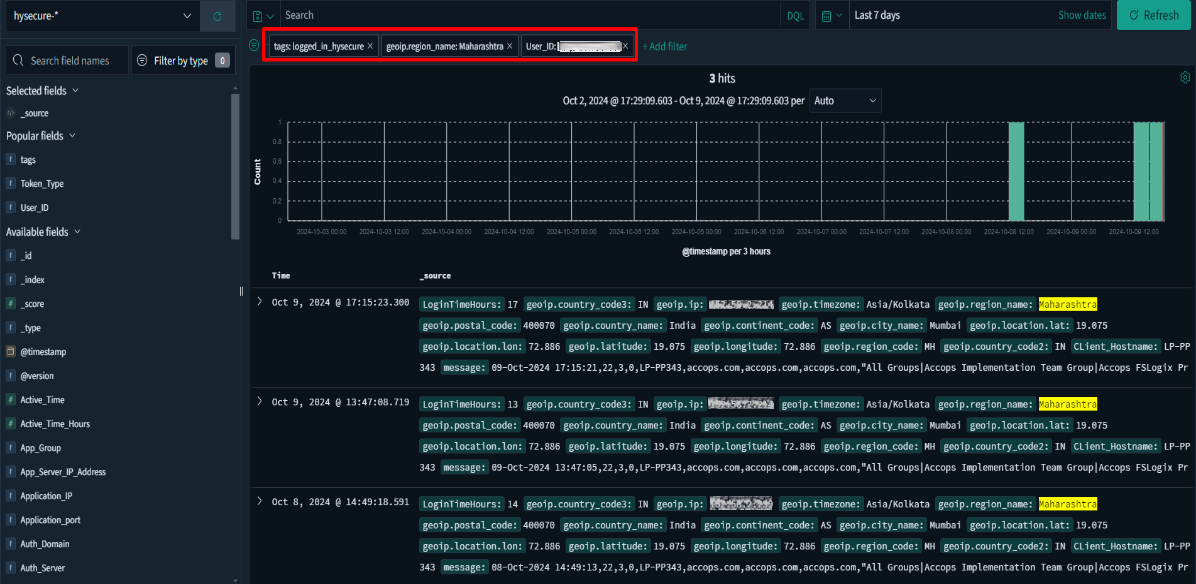
Click Save to apply the filter. The results of the search will be displayed in the format below. These are all the successful login events for the last 7 days. The filter applied on the top left, and 2422 hits at the top center denote 2422 successful login events were noted in the last 7 days. Expand each log to view a field-by-field breakdown of the event and to see the complete raw log under the Message field.
-
When examining a log, you can identify all the populated fields. One such field is called geoip.region_name, which indicates the name of the region (or state) where the login event occurred. For a complete list of all fields and tags, please refer to Appendix A.
-
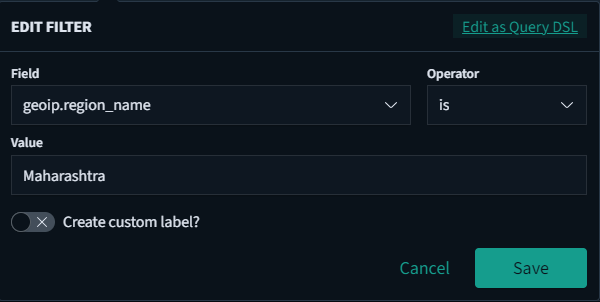
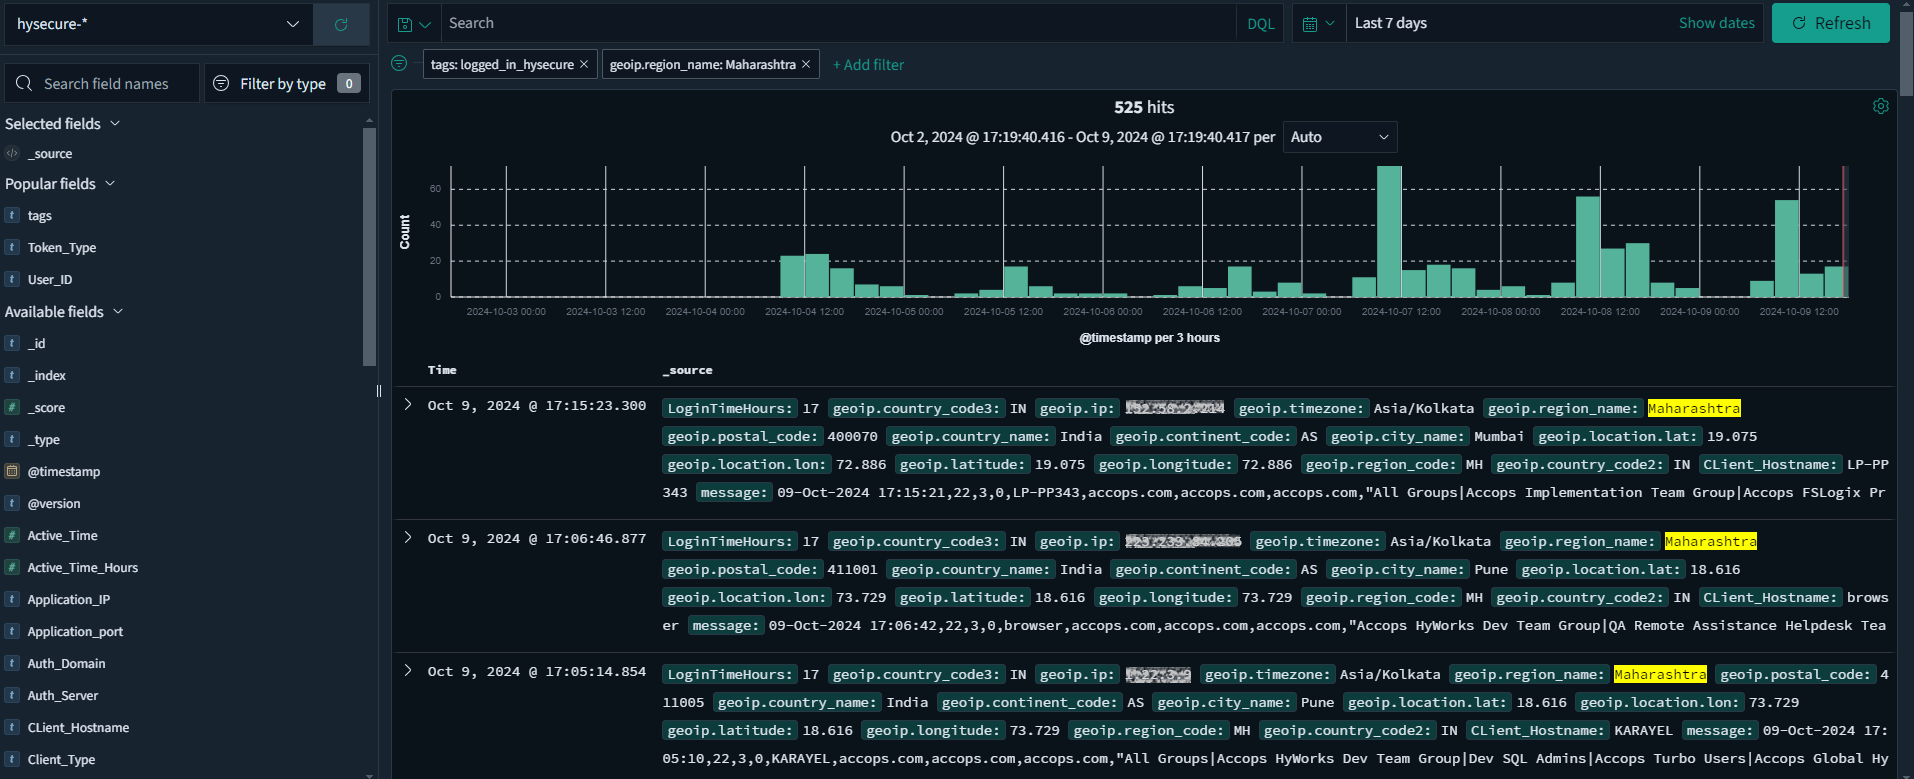
To filter the existing query for all login events from Maharashtra, please return and add a filter by typing Maharashtra in the Value field.
-
Click Save to apply the filter.
-
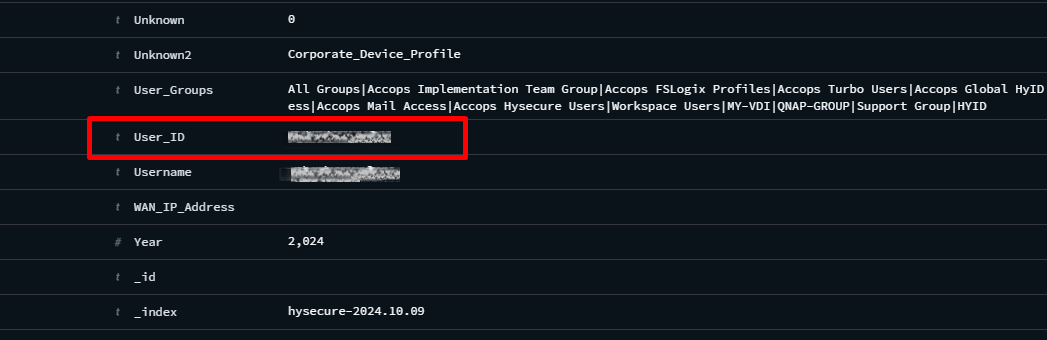
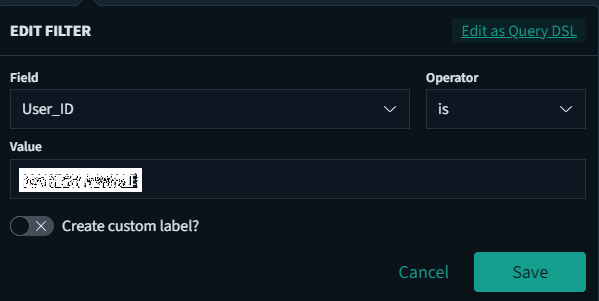
If we want to extract login events for a specific user, we can apply an additional filter. Upon expanding this log, note that the username for the event is found under the User_ID field.
-
By adding a filter for User ID, we can now receive successful login attempts for this user when logged in from Maharashtra. It is possible to extract specific data by using the filters feature.
-
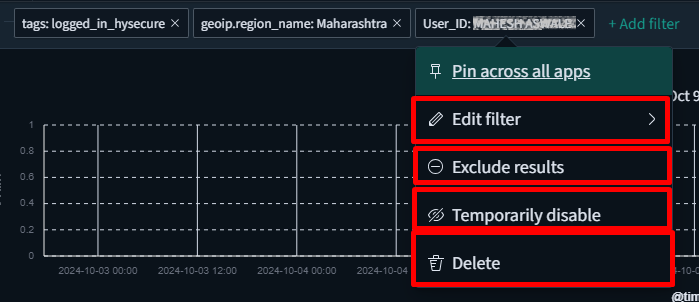
You can Edit, Exclude, Temporarily Disable, or Delete any filter by hovering over it and clicking the appropriate option.
-
-
Creating Custom Reports
You can generate a CSV report by populating the values from selected fields.
To create your own custom reports, follow the steps listed below:
-
Log in to the ARS web application.
-
In the Discover tab, choose the appropriate index from which you want to create a report.
-
Select the time frame for which you want the data to be displayed.
-
In the left pane, you will see a list of fields available for reporting. Hover over the desired field and click the Add button.
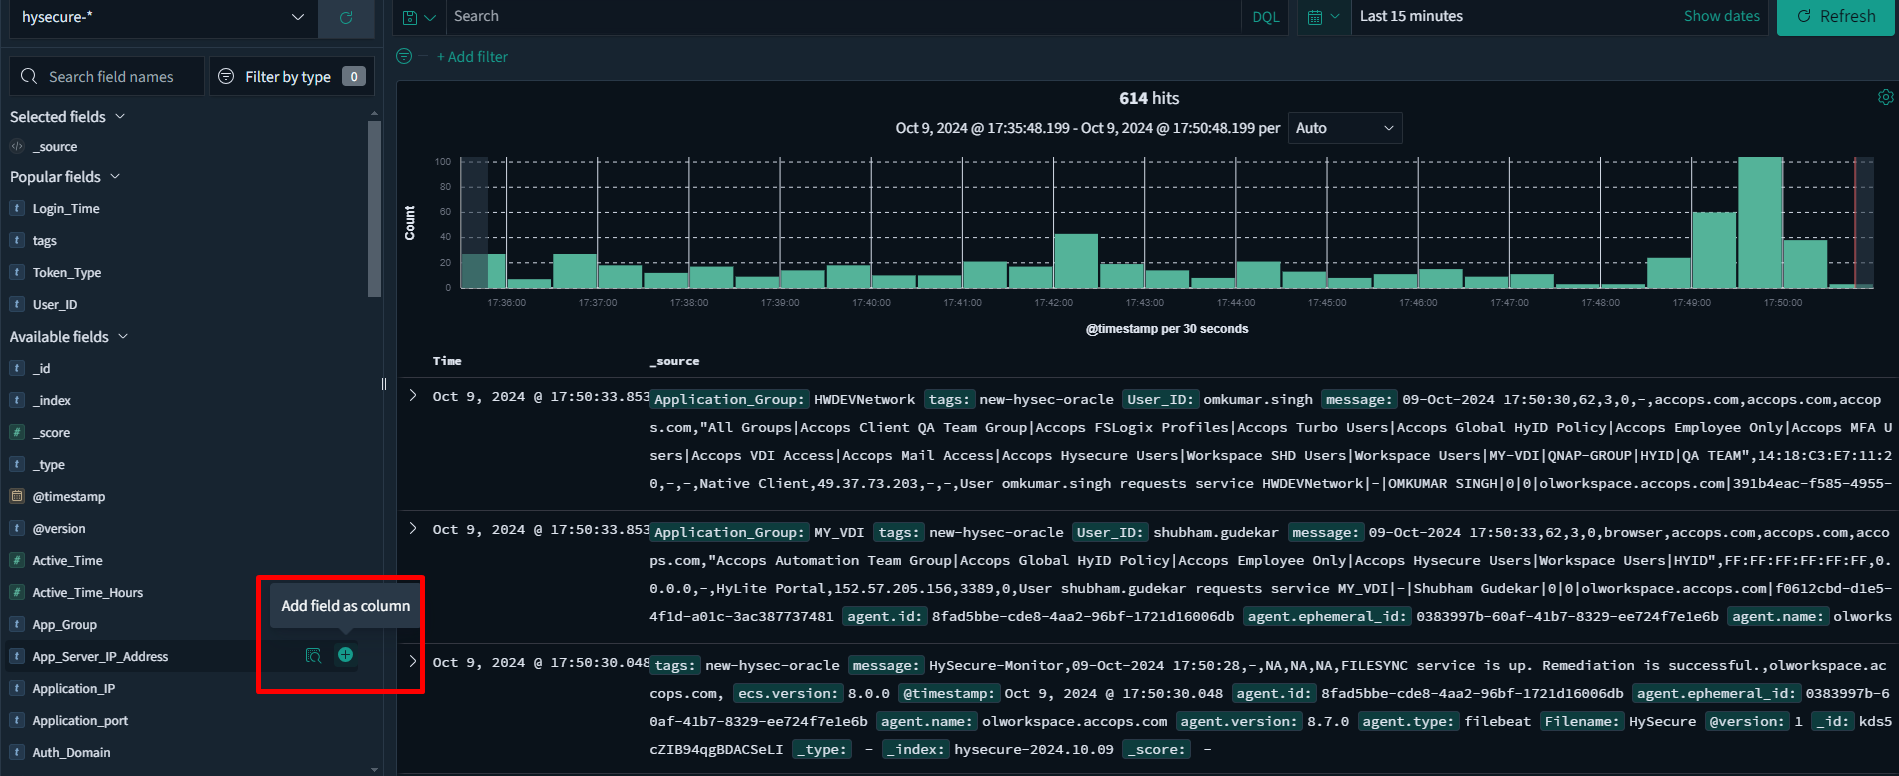
-
If you want to view only the events where a specific field has a value, add a filter: FIELD_NAME => Exists, and then click Save. For instance, when we first add the Active_Time field to the report, we may see multiple logs that do not have values.
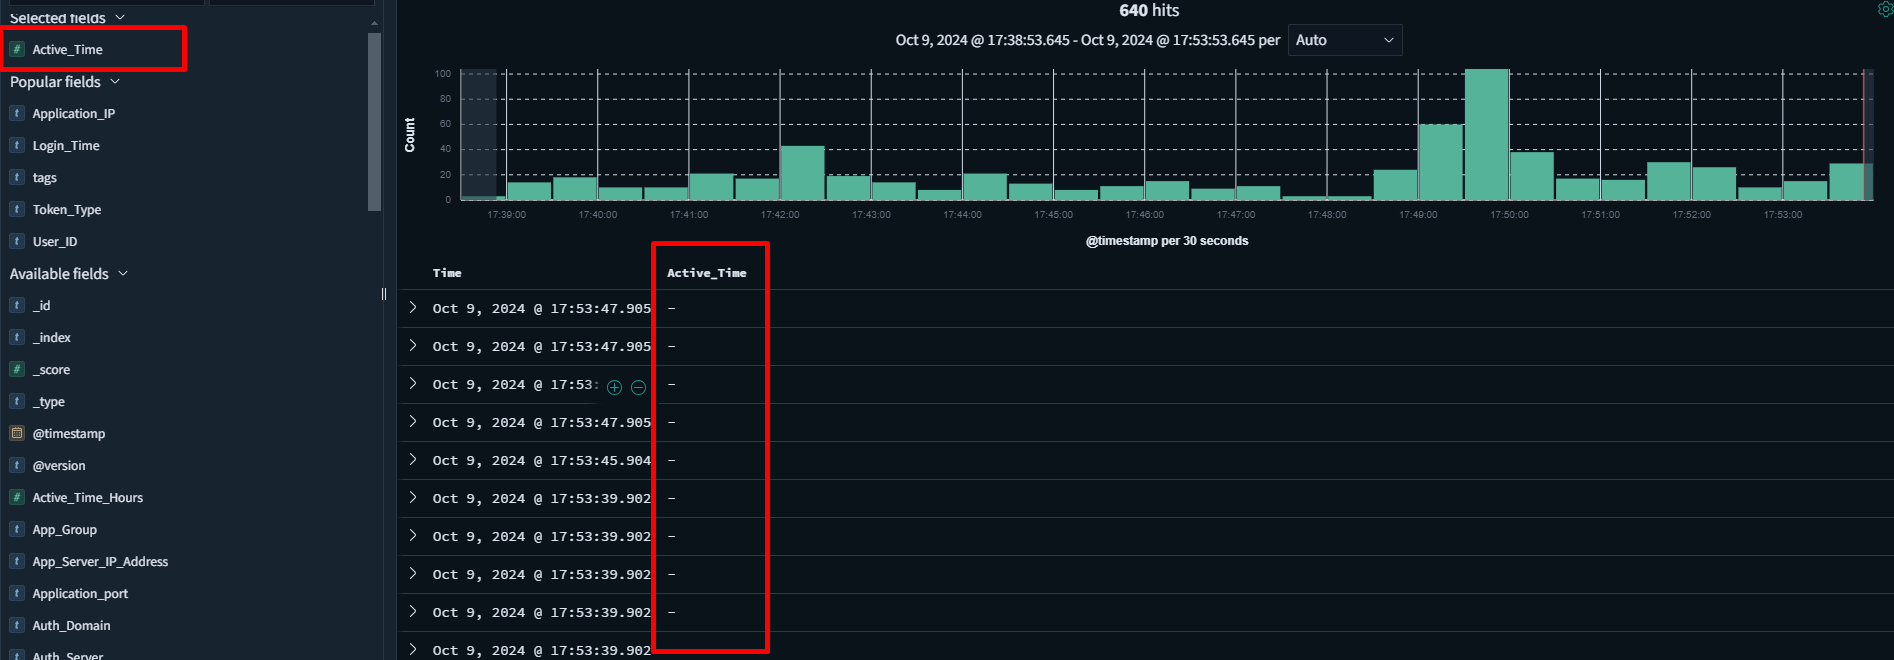

-
Click Save to obtain results that include only those entries with a specific value in the Client IP Address field.


-
You can re-arrange the column positions by hovering on the column name and clicking on the left/right arrow.

-
Click Save to save this report template with an appropriate name.

-
Navigate to Reporting > Generate CSV to download a copy of the report in CSV format.
By following these steps, you will be able to create a customized report based on your selected fields. By default, several pre-configured templates are available for use.
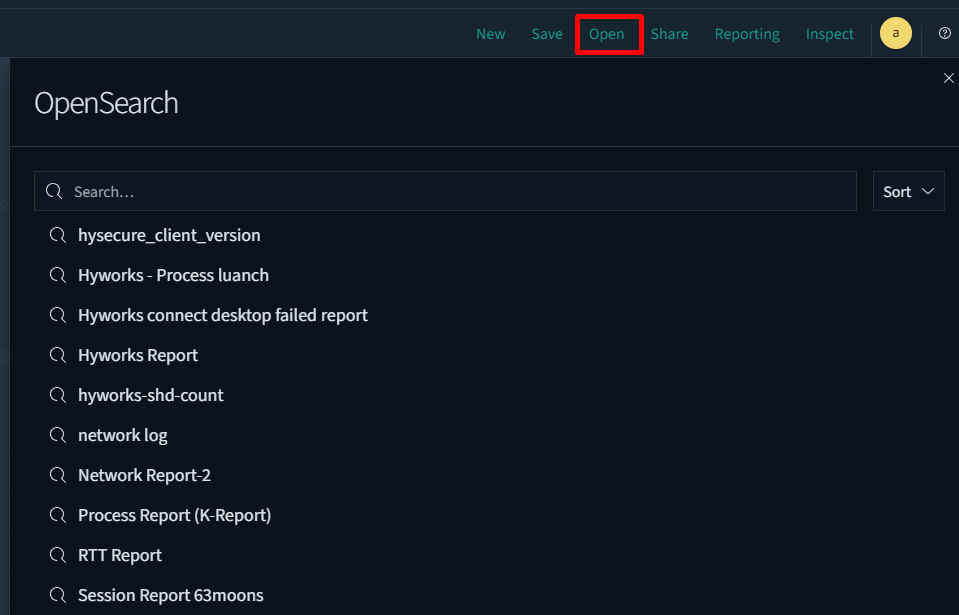
You can access these templates by navigating to the Open tab at the top and selecting the appropriate template.